

Development of light response and GABAergic excitation-to-inhibition switch in zebrafish retinal ganglion cells
- PMID: 20498234
- PMCID: PMC2916988
- DOI: 10.1113/jphysiol.2010.187088
Development of light response and GABAergic excitation-to-inhibition switch in zebrafish retinal ganglion cells
Abstract
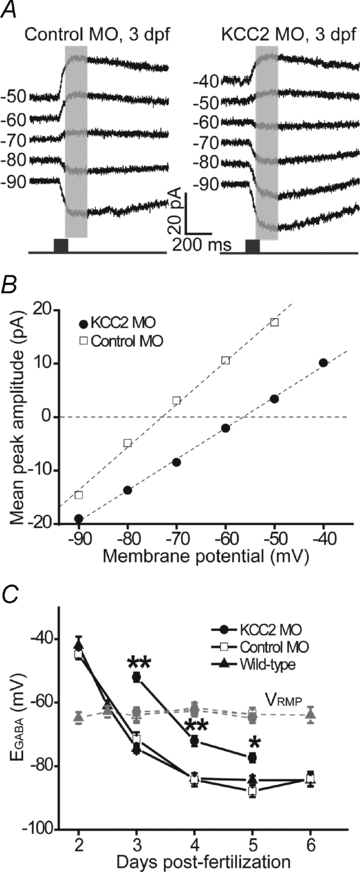
The zebrafish retina has been an important model for studying morphological development of neural circuits in vivo. However, its functional development is not yet well understood. To investigate the functional development of zebrafish retina, we developed an in vivo patch-clamp whole-cell recording technique in intact zebrafish larvae. We first examined the developmental profile of light-evoked responses (LERs) in retinal ganglion cells (RGCs) from 2 to 9 days post-fertilization (dpf). Unstable LERs were first observed at 2.5 dpf. By 4 dpf, RGCs exhibited reliable light responses. As the GABAergic system is critical for retinal development, we then performed in vivo gramicidin perforated-patch whole-cell recording to characterize the developmental change of GABAergic action in RGCs. The reversal potential of GABA-induced currents (E(GABA)) in RGCs gradually shifted from depolarized to hyperpolarized levels during 2-4 dpf and the excitation-to-inhibition (E-I) switch of GABAergic action occurred at around 2.5 dpf when RGCs became light sensitive. Meanwhile, GABAergic transmission upstream to RGCs also became inhibitory by 2.5 dpf. Furthermore, down-regulation of the K(+)/Cl() co-transporter (KCC2) by the morpholino oligonucleotide-based knockdown approach, which shifted RGC E(GABA) towards a more depolarized level and thus delayed the E-I switch by one day, postponed the appearance of RGC LERs by one day. In addition, RGCs exhibited correlated giant inward current (GICs) during 2.5-3.5 dpf. The period of GICs was shifted to 3-4.5 dpf by KCC2 knockdown. Taken together, the GABAergic E-I switch occurs coincidently with the emergence of light responses and GICs in zebrafish RGCs, and may contribute to the functional development of retinal circuits.
Figures


Similar articles
-
KCC2-dependent subcellular E(Cl) difference of ON-OFF retinal ganglion cells in larval zebrafish.Front Neural Circuits. 2013 May 28;7:103. doi: 10.3389/fncir.2013.00103. eCollection 2013. Front Neural Circuits. 2013. PMID: 23754987 Free PMC article.
-
Shift of intracellular chloride concentration in ganglion and amacrine cells of developing mouse retina.J Neurophysiol. 2006 Apr;95(4):2404-16. doi: 10.1152/jn.00578.2005. Epub 2005 Dec 21. J Neurophysiol. 2006. PMID: 16371454
-
Synaptic currents generating the inhibitory surround of ganglion cells in the mammalian retina.J Neurosci. 2001 Jul 1;21(13):4852-63. doi: 10.1523/JNEUROSCI.21-13-04852.2001. J Neurosci. 2001. PMID: 11425912 Free PMC article.
-
The role of early neural activity in the maturation of turtle retinal function.J Anat. 2001 Oct;199(Pt 4):375-83. doi: 10.1046/j.1469-7580.2001.19940375.x. J Anat. 2001. PMID: 11693298 Free PMC article. Review.
-
Two developmental switches in GABAergic signalling: the K+-Cl- cotransporter KCC2 and carbonic anhydrase CAVII.J Physiol. 2005 Jan 1;562(Pt 1):27-36. doi: 10.1113/jphysiol.2004.077495. Epub 2004 Nov 4. J Physiol. 2005. PMID: 15528236 Free PMC article. Review.
Cited by
-
Positive selection rather than relaxation of functional constraint drives the evolution of vision during chicken domestication.Cell Res. 2016 May;26(5):556-73. doi: 10.1038/cr.2016.44. Epub 2016 Apr 1. Cell Res. 2016. PMID: 27033669 Free PMC article.
-
Thalamic regulation of a visual critical period and motor behavior.Cell Rep. 2023 Apr 25;42(4):112287. doi: 10.1016/j.celrep.2023.112287. Epub 2023 Mar 22. Cell Rep. 2023. PMID: 36952349 Free PMC article.
-
Reciprocal Regulation of KCC2 Trafficking and Synaptic Activity.Front Cell Neurosci. 2019 Feb 20;13:48. doi: 10.3389/fncel.2019.00048. eCollection 2019. Front Cell Neurosci. 2019. PMID: 30842727 Free PMC article. Review.
-
Physiological implications of ocean acidification for marine fish: emerging patterns and new insights.J Comp Physiol B. 2018 Jan;188(1):1-13. doi: 10.1007/s00360-017-1105-6. Epub 2017 May 25. J Comp Physiol B. 2018. PMID: 28547292 Review.
-
Rules for Shaping Neural Connections in the Developing Brain.Front Neural Circuits. 2017 Jan 10;10:111. doi: 10.3389/fncir.2016.00111. eCollection 2016. Front Neural Circuits. 2017. PMID: 28119574 Free PMC article. Review.
References
-
- Akerman CJ, Cline HT. Refining the roles of GABAergic signalling during neural circuit formation. Trends Neurosci. 2007;30:382–389. - PubMed
-
- Bansal A, Singer JH, Hwang BJ, Xu W, Beaudet A, Feller MB. Mice lacking specific nicotinic acetylcholine receptor subunits exhibit dramatically altered spontaneous activity patterns and reveal a limited role for retinal waves in forming ON and OFF circuits in the inner retina. J Neurosci. 2000;20:7672–7681. - PMC - PubMed
-
- Ben-Ari Y. Excitatory actions of GABA during development: the nature of the nurture. Nat Rev Neurosci. 2002;3:728–739. - PubMed
-
- Ben-Ari Y, Gaiarsa JL, Tyzio R, Khazipov R. GABA: a pioneer transmitter that excites immature neurons and generates primitive oscillations. Physiol Rev. 2007;87:1215–1284. - PubMed
-
- Biehlmaier O, Neuhauss SC, Kohler K. Synaptic plasticity and functionality at the cone terminal of the developing zebrafish retina. J Neurobiol. 2003;56:222–236. - PubMed
Publication types
MeSH terms
Substances
LinkOut - more resources
Full Text Sources
Molecular Biology Databases
Research Materials