. 2010 Aug;30(15):3805-15.
doi: 10.1128/MCB.00050-10. Epub 2010 May 24.

Interplay between DNA methylation and transcription factor availability: implications for developmental activation of the mouse Myogenin gene

Affiliations

Interplay between DNA methylation and transcription factor availability: implications for developmental activation of the mouse Myogenin gene

Daniela Palacios et al. Mol Cell Biol. 2010 Aug.

Abstract

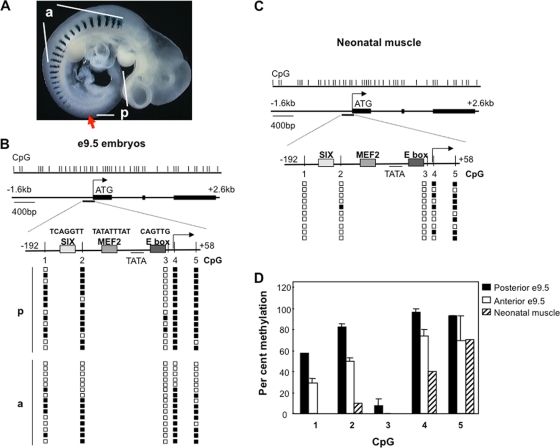
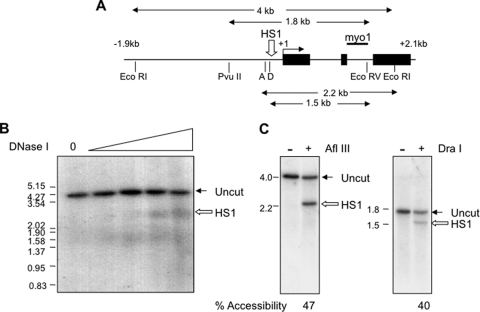
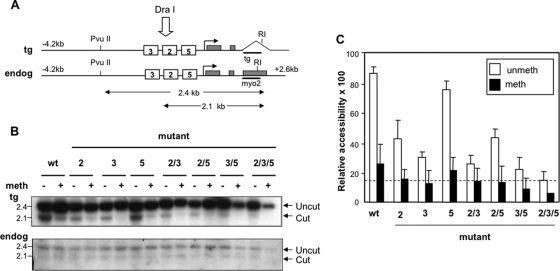
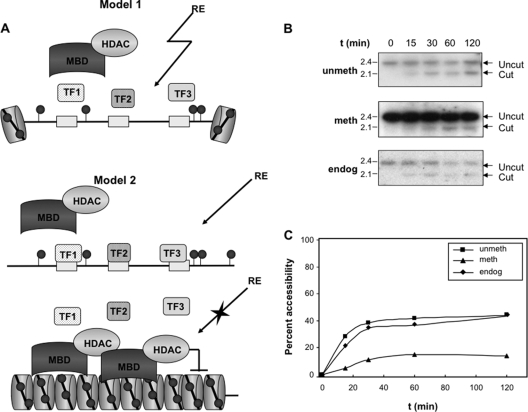
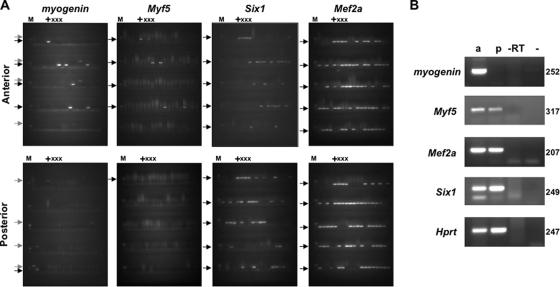
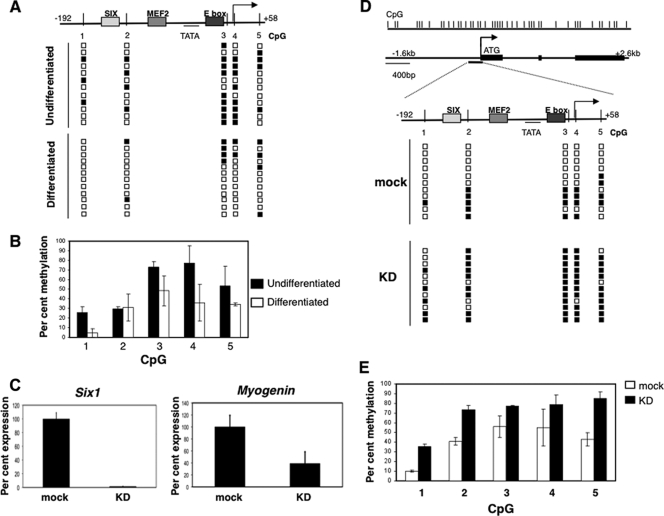
During development, gene activation is stringently regulated to restrict expression only to the correct cell type and correct developmental stage. Here, we present mechanistic evidence that suggests DNA methylation contributes to this regulation by suppressing premature gene activation. Using the mouse Myogenin promoter as an example of the weak CpG island class of promoters, we find that it is initially methylated but becomes demethylated as development proceeds. Full hypersensitive site formation of the Myogenin promoter requires both the MEF2 and SIX binding sites, but binding to only one site can trigger the partial chromatin opening of the nonmethylated promoter. DNA methylation markedly decreases hypersensitive site formation that now occurs at a detectable level only when binding to both MEF2 and SIX binding sites is possible. This suggests that the probability of activating the methylated promoter is low until two of the factors are coexpressed within the same cell. Consistent with this, the single-cell analysis of developing somites shows that the coexpression of MEF2A and SIX1, which bind the MEF2 and SIX sites, correlates with the fraction of cells that demethylate the Myogenin promoter. Taken together, these studies imply that DNA methylation helps to prevent inappropriate gene activation until sufficient activating factors are coexpressed.


Figures

FIG. 1.
FIG. 1.
Myogenin promoter becomes demethylated during skeletal muscle differentiation. (A) Expression pattern of Myogenin at e9.5. An embryo from transgenic mice in which lacZ expression is under the control of the Myogenin 5′ regulatory region was stained for β-galactosidase. Anterior and posterior somites (including presomitic mesoderm) are indicated. The red arrow indicates the most posterior somite expressing Myogenin. (B and C) Combined bisulfite analysis of the endogenous Myogenin promoter and this promoter in the transgene array (49) in (B) posterior (p) and anterior (a) somites of e9.5 embryos and (C) skeletal muscle cells isolated from neonatal mice. The upper panel shows the position of CpG dinucleotides in the Myogenin promoter and gene. Filled boxes in the second panel indicate Myogenin exons. Bisulfite products were analyzed by both direct sequencing and by cloning and PCR, with equivalent results. Unmethylated and methylated CpG dinucleotides, as determined by sequencing the clones from a representative experiment, are shown by open and filled squares, respectively. The sequences of the transcription factor binding sites are given above the names of these sites; none of these have a CpG dinucleotide, but since MBDs can indirectly repress the activation of methylated promoters (6), the presence of CpG in the transcription factor binding site is not essential for repression. (D) Graph showing the average percent methylation of each cytosine in the Myogenin promoter, calculated as (number of methylated alleles/total number of clones analyzed) × 100. Error bars show the standard errors from three independent experiments; a total of 30 clones each from anterior and posterior somites were sequenced.
FIG. 2.
FIG. 2.
Accessibility of the Myogenin promoter to DNase I and restriction enzymes in differentiated C2C12 myotubes. (A) Map of the mouse Myogenin gene from kb −1.9 to +2.3. Black boxes indicate exons and the horizontal bar, labeled myo1, indicates the probe. EcoRI, EcoRV, PvuII, AflIII (A), and DraI (D) restriction sites are shown below the gene. (B) DNase I-hypersensitive site in the Myogenin promoter. C2C12 cells were differentiated for 48 h, and genomic DNA was digested with EcoRI to map the DNase I-hypersensitive site HS1. Marker sizes (in kb) are shown to the left of the gel. (C) Accessibility of HS1 to restriction enzymes. Nuclei from differentiated C2C12 cells were harvested and digested with AflIII or DraI. Genomic DNA was analyzed as described for panel B, except that DraI accessibility was assessed using EcoRV and PvuII to generate the parental fragment.
FIG. 3.
FIG. 3.
Methylation of the Myogenin promoter decreases the probability of hypersensitive site formation. (A) Diagram of the endogenous Myogenin gene (endog) and transgene (tg). White boxes represent the binding sites for bHLH (5), MEF2 (2), and SIX factors (3), and gray boxes indicate exons. The last exon in the transgene was replaced with the rabbit β-globin poly(A) tail. Cutting sites for DraI, PvuII, and EcoRI are indicated, and the sizes of the parental and DraI-cut bands are shown beneath the diagram (not to scale). The probes (tg and myo2) are indicated by horizontal bars. (B) Accessibility of the methylated and nonmethylated Myogenin promoter. C2C12 cells were stably transfected with mock methylated (−) or methylated (+) wild-type (wt) Myogenin construct or with constructs in which the factor binding sites were mutated. Following differentiation for 6 days, nuclei were digested with DraI; genomic DNA was cut with EcoRI and PvuII. Marker sizes (in kb) are given to the left of the gel. (C) Graph showing the relative accessibility of the transgene promoter for each cell line, normalized to the accessibility of the endogenous gene via the calculation [transgene cut/(transgene cut + uncut)]/[endogenous cut/(endogenous cut/(endogenous cut + uncut)] × 100. Error bars show standard errors from three independent experiments. The dotted line shows the level of accessibility when all factor binding sites are mutated and is considered to be the background level of accessibility due to restriction enzyme cutting in between nucleosomes (3).
FIG. 4.
FIG. 4.
Methylation of the Myogenin promoter decreases the number of cells in which the hypersensitive site is formed. (A) Models of hypersensitive site formation. Model 1 proposes that the nucleosome, methylated DNA binding proteins (MBD), and transcription factors bind the promoter simultaneously to slow cutting by the restriction enzyme but do not completely prevent its accessibility. Model 2 proposes an all-or-none mechanism in which the hypersensitive site is either fully formed (upper) or completely inaccessible (lower). (B) Untransfected C2C12 cells and those transfected with either the unmethylated or the methylated wild-type constructs were differentiated for 6 days. Nuclei then were harvested and digested with DraI for the times indicated, and genomic DNA was prepared and analyzed as described for Fig. 3. Marker sizes (in kb) are given to the left of the gel. (C) Graph showing the percent accessibility of the endogenous locus (diamonds) and unmethylated (squares) and methylated (triangles) transgenes following cutting by DraI.
FIG. 5.
FIG. 5.
Expression of Mef2A, Six1, Myf5, and Myogenin in e9.5 anterior and posterior somites. (A) Expression in single cells. Single cells from anterior and posterior somites (upper and lower panels, respectively) were deposited into single wells of a 96-well plate by flow cytometry. Following multiplex RT-PCR using the primers for the specific genes shown in the second round, the samples from the individual wells were loaded onto the 96 lanes of the gel shown. The first lane in each panel shows the molecular weight marker (M). Lanes 2 to 5 are from wells that contain no cells, whereas lane 6 is from a well that contains 100 cells (+) and lanes 7 to 9 are from wells that contain 10 cells each (x). All other lanes are from wells that contain one cell each. Black arrows indicate RT-PCR products. The presence of a higher-molecular-weight band in the Myogenin RT-PCR product is due to contamination with genomic DNA and is indicated by lighter arrows. The fastest-migrating band in the gel of the Myf5 RT-PCR products is the primers. (B) Multiplex RT-PCR analysis in anterior (lane 1) and posterior (lane 2) somites of e9.5 embryos, using oligonucleotides to amplify Myogenin, Myf5, Mef2A, Six1, and Hprt cDNAs. Lane 3 does not contain reverse transcriptase in the RT reaction mixture, whereas lane 4 does not contain RNA (negative controls). The sizes of the products (in bp) are given to the right of each panel.
FIG. 6.
FIG. 6.
SIX1 regulates the demethylation of the Myogenin promoter. (A) The Myogenin promoter is demethylated upon the differentiation of C2C12 cells. The level of the methylation of the Myogenin promoter from differentiated and undifferentiated C2C12 cells from one representative experiment. (B) The percent methylation of promoter CpGs, calculated as described for Fig. 1. The data represent the averages from two independent experiments; error bars indicate the standard errors. (C) Knockdown of Six1. The level of Six1 expression was determined in cDNA prepared from cells mock transfected or transfected with siRNA against Six1 via quantitative PCR, normalizing to the level of Hprt expression; Myogenin expression was used as a control to check that the cells had differentiated. (D) Knockdown of Six1 prevents demethylation of the Myogenin promoter. C2C12 cells were differentiated for 48 h following the knockdown of Six1 (KD) or mock knockdown (mock), and the level of methylation was determined by the bisulfite sequencing of individual clones. The diagram shows the methylation of 11 (mock) and 12 (KD) representative clones. (E) The graph shows the percent methylation calculated from sequencing >20 clones of each type from two independent experiments. While the trend in methylation changes in the C2C12 cell line reflects those that occur in primary tissues in vivo, the methylation of CpG 3 is considerably higher, and we suggest this is due to differences in DNA methylation between cell lines and primary tissues that have been described previously (1).

Similar articles

Cited by

References

    1. Antequera, F., J. Boyes, and A. Bird. 1990. High levels of de novo methylation and altered chromatin structure at CpG islands in cell lines. Cell 62:503-514. - PubMed
    1. Ball, M. P., J. B. Li, Y. Gao, J. H. Lee, E. M. LeProust, I. H. Park, B. Xie, G. Q. Daley, and G. M. Church. 2009. Targeted and genome-scale strategies reveal gene-body methylation signatures in human cells. Nat. Biotechnol. 27:361-368. - PMC - PubMed
    1. Baumann, M., A. Mamais, F. McBlane, H. Xiao, and J. Boyes. 2003. Regulation of V(D)J. recombination by nucleosome positioning at recombination signal sequences. EMBO J. 22:5197-5207. - PMC - PubMed
    1. Berghella, L., L. De Angelis, T. De Buysscher, A. Mortazavi, S. Biressi, S. V. Forcales, D. Sirabella, G. Cossu, and B. J. Wold. 2008. A highly conserved molecular switch binds MSY-3 to regulate myogenin repression in postnatal muscle. Genes Dev. 22:2125-2138. - PMC - PubMed
    1. Berkes, C. A., D. A. Bergstrom, B. H. Penn, K. J. Seaver, P. S. Knoepfler, and S. J. Tapscott. 2004. Pbx marks genes for activation by MyoD indicating a role for a homeodomain protein in establishing myogenic potential. Mol. Cell 14:465-477. - PubMed

Publication types

LinkOut - more resources