T-cell receptor microclusters critical for T-cell activation are formed independently of lipid raft clustering
- PMID: 20498282
- PMCID: PMC2897564
- DOI: 10.1128/MCB.00160-10
T-cell receptor microclusters critical for T-cell activation are formed independently of lipid raft clustering
Abstract
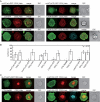
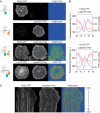
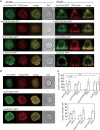
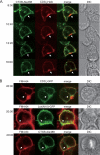
We studied the function of lipid rafts in generation and signaling of T-cell receptor microclusters (TCR-MCs) and central supramolecular activation clusters (cSMACs) at immunological synapse (IS). It has been suggested that lipid raft accumulation creates a platform for recruitment of signaling molecules upon T-cell activation. However, several lipid raft probes did not accumulate at TCR-MCs or cSMACs even with costimulation and the fluorescence resonance energy transfer (FRET) between TCR or LAT and lipid raft probes was not induced at TCR-MCs under the condition of positive induction of FRET between CD3 zeta and ZAP-70. The analysis of LAT mutants revealed that raft association is essential for the membrane localization but dispensable for TCR-MC formation. Careful analysis of the accumulation of raft probes in the cell interface revealed that their accumulation occurred after cSMAC formation, probably due to membrane ruffling and/or endocytosis. These results suggest that lipid rafts control protein translocation to the membrane but are not involved in the clustering of raft-associated molecules and therefore that the lipid rafts do not serve as a platform for T-cell activation.
Figures


Similar articles
-
CD45 signals outside of lipid rafts to promote ERK activation, synaptic raft clustering, and IL-2 production.J Immunol. 2005 Feb 1;174(3):1479-90. doi: 10.4049/jimmunol.174.3.1479. J Immunol. 2005. PMID: 15661907
-
TCR and Lat are expressed on separate protein islands on T cell membranes and concatenate during activation.Nat Immunol. 2010 Jan;11(1):90-6. doi: 10.1038/ni.1832. Epub 2009 Dec 13. Nat Immunol. 2010. PMID: 20010844 Free PMC article.
-
SH2 domain containing leukocyte phosphoprotein of 76-kDa (SLP-76) feedback regulation of ZAP-70 microclustering.Proc Natl Acad Sci U S A. 2010 Jun 1;107(22):10166-71. doi: 10.1073/pnas.0909112107. Epub 2010 May 13. Proc Natl Acad Sci U S A. 2010. PMID: 20534575 Free PMC article.
-
Lipid rafts in T cell receptor signalling.Mol Membr Biol. 2006 Jan-Feb;23(1):49-57. doi: 10.1080/09687860500453673. Mol Membr Biol. 2006. PMID: 16611580 Free PMC article. Review.
-
T cell activation at the immunological synapse: vesicles emerge for LATer signaling.Sci Signal. 2010 May 11;3(121):pe16. doi: 10.1126/scisignal.3121pe16. Sci Signal. 2010. PMID: 20460646 Review.
Cited by
-
Analysis of detergent-free lipid rafts isolated from CD4+ T cell line: interaction with antigen presenting cells promotes coalescing of lipid rafts.Cell Commun Signal. 2011 Dec 8;9(1):31. doi: 10.1186/1478-811X-9-31. Cell Commun Signal. 2011. PMID: 22151974 Free PMC article.
-
The adaptor protein LAT serves as an integration node for signaling pathways that drive T cell activation.Wiley Interdiscip Rev Syst Biol Med. 2013 Jan-Feb;5(1):101-10. doi: 10.1002/wsbm.1194. Epub 2012 Nov 13. Wiley Interdiscip Rev Syst Biol Med. 2013. PMID: 23150273 Free PMC article. Review.
-
Focal adhesion kinase negatively regulates Lck function downstream of the T cell antigen receptor.J Immunol. 2013 Dec 15;191(12):6208-21. doi: 10.4049/jimmunol.1301587. Epub 2013 Nov 13. J Immunol. 2013. PMID: 24227778 Free PMC article.
-
A quantitative assessment of costimulation and phosphatase activity on microclusters in early T cell signaling.PLoS One. 2013 Oct 30;8(10):e79277. doi: 10.1371/journal.pone.0079277. eCollection 2013. PLoS One. 2013. PMID: 24205378 Free PMC article.
-
Dynamic palmitoylation and the role of DHHC proteins in T cell activation and anergy.Adv Immunol. 2011;109:1-44. doi: 10.1016/B978-0-12-387664-5.00001-7. Adv Immunol. 2011. PMID: 21569911 Free PMC article. Review.
References
-
- Aguado, E., S. Richelme, S. Nunez-Cruz, A. Miazek, A. M. Mura, M. Richelme, X. J. Guo, D. Sainty, H. T. He, B. Malissen, and M. Malissen. 2002. Induction of T helper type 2 immunity by a point mutation in the LAT adaptor. Science 296:2036-2040. - PubMed
-
- Burack, W. R., K. H. Lee, A. D. Holdorf, M. L. Dustin, and A. S. Shaw. 2002. Cutting edge: quantitative imaging of raft accumulation in the immunological synapse. J. Immunol. 169:2837-2841. - PubMed
Publication types
MeSH terms
Substances
LinkOut - more resources
Full Text Sources
Molecular Biology Databases
Research Materials
