. 2010 Nov 4;116(18):3564-71.
doi: 10.1182/blood-2009-09-240978. Epub 2010 May 24.

Profiling of histone H3 lysine 9 trimethylation levels predicts transcription factor activity and survival in acute myeloid leukemia

Collaborators, Affiliations

Profiling of histone H3 lysine 9 trimethylation levels predicts transcription factor activity and survival in acute myeloid leukemia

Carsten Müller-Tidow et al. Blood. .

Abstract

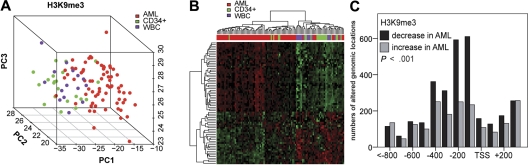
Acute myeloid leukemia (AML) is commonly associated with alterations in transcription factors because of altered expression or gene mutations. These changes might induce leukemia-specific patterns of histone modifications. We used chromatin-immunoprecipitation on microarray to analyze histone 3 lysine 9 trimethylation (H3K9me3) patterns in primary AML (n = 108), acute lymphoid leukemia (n = 28), CD34(+) cells (n = 21) and white blood cells (n = 15) specimens. Hundreds of promoter regions in AML showed significant alterations in H3K9me3 levels. H3K9me3 deregulation in AML occurred preferentially as a decrease in H3K9me3 levels at core promoter regions. The altered genomic regions showed an overrepresentation of cis-binding sites for ETS and cyclic adenosine monophosphate response elements (CREs) for transcription factors of the CREB/CREM/ATF1 family. The decrease in H3K9me3 levels at CREs was associated with increased CRE-driven promoter activity in AML blasts in vivo. AML-specific H3K9me3 patterns were not associated with known cytogenetic abnormalities. But a signature derived from H3K9me3 patterns predicted event-free survival in AML patients. When the H3K9me3 signature was combined with established clinical prognostic markers, it outperformed prognosis prediction based on clinical parameters alone. These findings demonstrate widespread changes of H3K9me3 levels at gene promoters in AML. Signatures of histone modification patterns are associated with patient prognosis in AML.


Figures

Figure 1
Figure 1
ChIP-Chip profiling identifies leukemia-specific loci with altered H3K9me3 loci in leukemia. (A) The Venn diagrams depict the number of genomic loci that were significantly altered in the indicated analyses. Genomic loci included here had a Benjamini-Hochberg corrected P < .05 and were at least 2-fold altered between 2 analyzed groups. The numbers in the overlaps indicate genomic loci that were altered in the same direction in at least 2 analyses. A detailed list of all genomic loci altered in H3K9me3 levels is provided in the supplemental data. (B) PCA identifies distinct patterns of H3K9me3 distribution in AML compared with ALL samples. PC1 is the first principal component, and PC2 and PC3 are the second and third principle components, respectively. (C) Gene Ontology analysis of promoter regions with altered H3K9me3 levels. Among others, regulation of DNA binding and myeloid leukocyte differentiation was overrepresented, indicating that functionally relevant genes were altered in H3K9me3 levels between AML and ALL specimens. (D) Genomic regions differing in H3K9me3 patterns were hierarchically clustered and are indicated in this heatmap. Green represents higher H3K9me3 levels; and red, decreased H3K9me3 levels.
Figure 2
Figure 2
Chromatin modification changes comparing CD34+ hematopoietic progenitors with AML blasts. (A) PCA identifies distinct patterns of H3K9me3 in AML versus CD34+ progenitors and WBCs. (B) Genomic regions differing in H3K9me3 patterns were hierarchically clustered and are indicated in this heatmap. Green represents higher H3K9me3 levels; and red, decreased H3K9me3 levels. (C) Number of genomic locations altered in H3K9me3 levels between AML and CD34+ specimens with regard to their distance from the TSS. A high number of core promoter regions (−400 to TSS) showed decreased H3K9me3 levels in AML.
Figure 3
Figure 3
Association of histone modifications with transcription factor binding sites of different specimen groups. (A) Association of transcription factor binding sites with histone modification changes was analyzed. Overall, 150 bp enclosing each oligonucleotide was screened with high stringency for approximately 600 bona fide transcription factor binding sites. GSA was used to identify associations between transcription factor binding sites and histone modification changes. (B) GSA analyses were performed independently for regions with different distances to the TSSs. Approximately 600 bona fide transcription factor binding sites (TRANSFAC database) were analyzed by GSA in the H3K9me3 dataset of AML versus CD34+ in different promoter regions, and the number of resulting P values in each range was plotted. A shift to lower P values indicates an association between the presence of specific transcription factor binding sites and changes in H3K9me3 levels in the core promoter region. (C) Among the overrepresented transcription factor binding sites, ETS and CRE binding elements were most prominently altered in different datasets. AML specimens consistently showed decreased levels of H3K9me3 at binding sites for most ETS factors and CREB.
Figure 4
Figure 4
Increased CREB-dependent promoter activity in AML blasts in vivo is associated with H3K9me3 levels at CRE-binding sites. (A) Primary CD34+ (n = 3) and AML blasts (n = 10) were transiently transfected with a CRE-driven reporter gene construct (or empty vector as a control; data not shown) and cultured for 6 hours before luciferase activity was determined. Transfection efficiency was normalized to renilla luciferase activity. To analyze the effect of stimulation of the cAMP pathway, forskolin was added after transfection and samples were analyzed accordingly (diagram on the right). In the absence (P < .01) and presence (P < .01) of forskolin, CRE-driven reporter activity was significantly higher in AML blasts. Indicated are mean ± SEM (Mann-Whitney U test). (B) PCA is shown that groups AML and CD34+ progenitor cells according to their H3K9me3 levels at genomic loci with CREs. Indicated are also AML specimens with a more “CD34-like” higher H3K9me3 level at CRE sites and those with “true AML-like” lower H3K9me3 levels at CRE sites. (C) Luciferase reporter assays were performed to identify differences in CRE-driven promoter activities within AML samples. AML samples were selected because of their H3K9me signature either close to the CD34+ pattern or to the AML pattern and analyzed for CRE-dependent promoter activity in transient transfection assays. The samples used for analysis are indicated in Figure 4B. “Control” depicts AML blasts (with AML-like H3K9me3 level) transfected with a promoter-less luciferase construct. AML patients with a CD34-like H3K9me3 pattern showed only minimal CREB-dependent promoter activity, whereas AML blasts with an “AML-like” H3K9me3 pattern showed more than 60-fold higher CREB-dependent promoter activity. Similar analyses carried out in the presence of forskolin to stimulate the cAMP-response pathway are indicated on the right. Indicated are mean ± SD.
Figure 5
Figure 5
A H3K9me3 chromatin signature predicts EFS in AML patients. (A) EFS analyses were performed according to Bair and Tibshirani. A predictor was built based on 91 genomic regions with significant association (P < .001) with EFS in 57 AML patients. Overall, 35 patients were predicted to be at high risk and 22 to be at low risk. The predictor separated well between patients with good and poor prognosis. Mean EFS was 43.5 months (low risk) versus 12.4 months (high risk). A permutation test analysis identified the quality of the predictor to be based on chance to be less than 10% (P = .07, permutation test). (B) A clinical predictor for EFS was built based on karyotype, age, and FLT3/NPM1 mutation status, which are the strongest clinical predictors for survival in AML patients. For this predictor, 26 and 31 patients were predicted to be at high and low risk, respectively. As expected, this predictor also separated well between surviving and nonsurviving patients. Mean EFS was 42.2 versus 17.5 months. (C) A combined predictor was built from H3K9me3 and the clinical covariates. For this predictor, 39 and 18 patients were predicted to be at high and low risk, respectively. This predictor predicted the outcome better than the clinical predictor (P = .02, permutation test). The EFS times of the predicted groups were 53.9 versus 17.2 months for the low-risk and the high-risk groups, respectively. (D) A heatmap of genomic loci whose H3K9me3 level were associated with EFS. The columns represent patient specimens that were ordered from the left to the right according to their EFS status and the time of censoring or event. Patients marked with the blue bar “Event Free Survival” were alive without relapse at the time of analysis. The bar in red indicates patients with relapse, refractory disease, or death. These were arranged with the longest EFS time on the left. Gene loci in rows were hierarchically clustered for H3K9me3 levels (red indicates low-level H3K9me3; and green, high-level H3K9me3). Two large clusters are visible with the group of good prognosis H3K9me3 patterns extending to 6 additional patients in the other group. *Each of these patients experienced an event more than 3 years after initial diagnosis indicating a generally more favorable prognosis. (E) Gene Ontology analysis of genes whose level of H3K9 trimethylation was closely associated with patient survival in the combined predictor. Indicated are Gene Ontology categories with at least 2.5-fold overrepresentation. All changes were statistically significant with P < .01.

Similar articles

Cited by

References

    1. Estey E, Dohner H. Acute myeloid leukaemia. Lancet. 2006;368(9550):1894–1907. - PubMed
    1. Marcucci G, Mrozek K, Bloomfield CD. Molecular heterogeneity and prognostic biomarkers in adults with acute myeloid leukemia and normal cytogenetics. Curr Opin Hematol. 2005;12(1):68–75. - PubMed
    1. Laslo P, Spooner CJ, Warmflash A, et al. Multilineage transcriptional priming and determination of alternate hematopoietic cell fates. Cell. 2006;126(4):755–766. - PubMed
    1. Rosenbauer F, Koschmieder S, Steidl U, Tenen DG. Effect of transcription-factor concentrations on leukemic stem cells. Blood. 2005;106(5):1519–1524. - PMC - PubMed
    1. Rosenbauer F, Wagner K, Kutok JL, et al. Acute myeloid leukemia induced by graded reduction of a lineage-specific transcription factor, PU.1. Nat Genet. 2004;36(6):624–630. - PubMed

Publication types

MeSH terms