. 2010 Aug;153(4):1859-70.
doi: 10.1104/pp.110.157263. Epub 2010 May 24.

Tobacco mosaic virus infection results in an increase in recombination frequency and resistance to viral, bacterial, and fungal pathogens in the progeny of infected tobacco plants

Affiliations

Tobacco mosaic virus infection results in an increase in recombination frequency and resistance to viral, bacterial, and fungal pathogens in the progeny of infected tobacco plants

Palak Kathiria et al. Plant Physiol. 2010 Aug.

Abstract

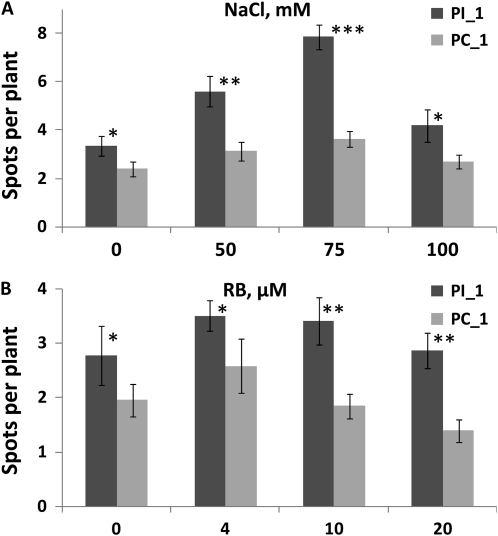
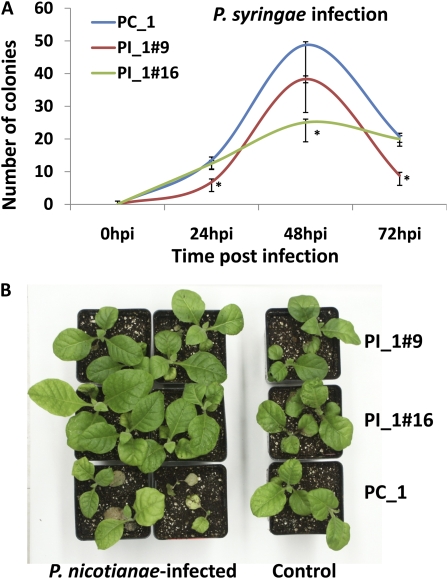
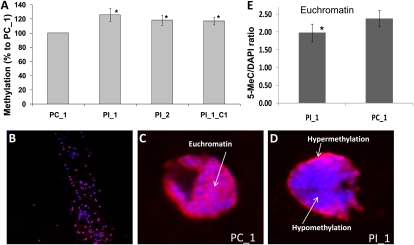
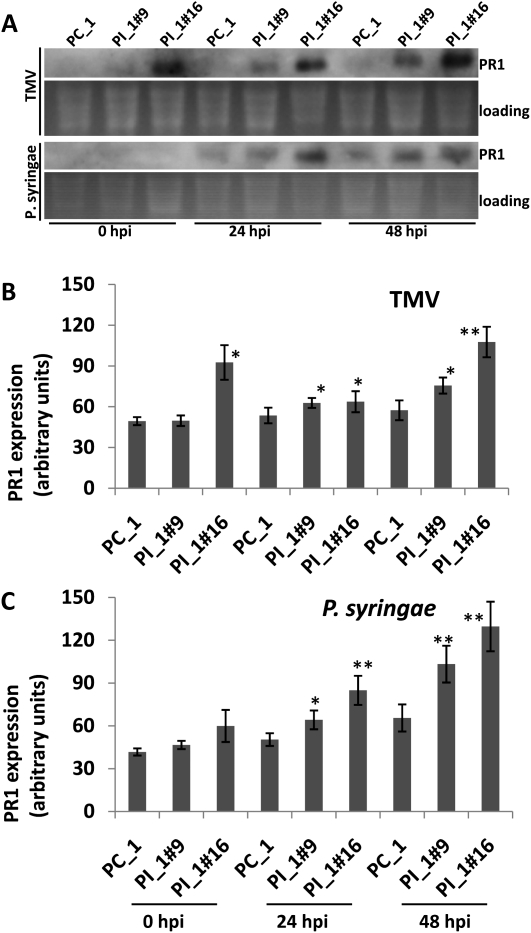
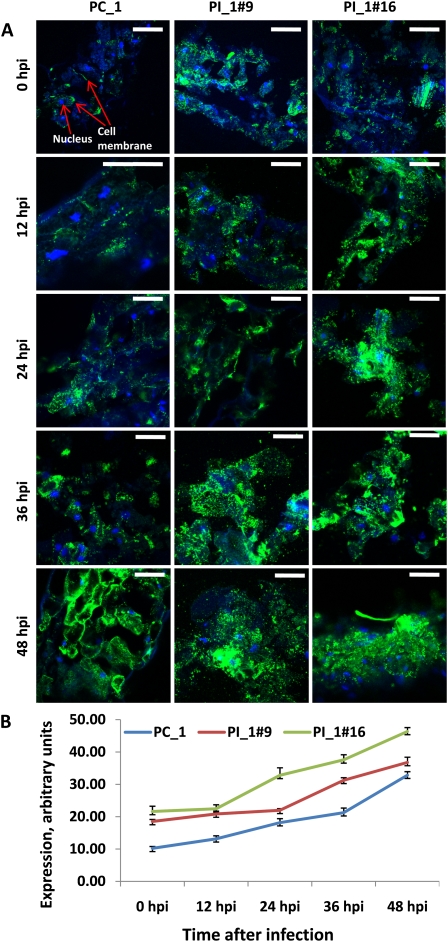
Our previous experiments showed that infection of tobacco (Nicotiana tabacum) plants with Tobacco mosaic virus (TMV) leads to an increase in homologous recombination frequency (HRF). The progeny of infected plants also had an increased rate of rearrangements in resistance gene-like loci. Here, we report that tobacco plants infected with TMV exhibited an increase in HRF in two consecutive generations. Analysis of global genome methylation showed the hypermethylated genome in both generations of plants, whereas analysis of methylation via 5-methyl cytosine antibodies demonstrated both hypomethylation and hypermethylation. Analysis of the response of the progeny of infected plants to TMV, Pseudomonas syringae, or Phytophthora nicotianae revealed a significant delay in symptom development. Infection of these plants with TMV or P. syringae showed higher levels of induction of PATHOGENESIS-RELATED GENE1 gene expression and higher levels of callose deposition. Our experiments suggest that viral infection triggers specific changes in progeny that promote higher levels of HRF at the transgene and higher resistance to stress as compared with the progeny of unstressed plants. However, data reported in these studies do not establish evidence of a link between recombination frequency and stress resistance.


Figures

Figure 1.
Figure 1.
Schematic representation of the experimental setup. Single leaves of 10-week-old SR1 tobacco plants were inoculated with 200 ng of TMV RNA (20 plants) or mock treated (20 plants). At 24 hpi, upper nontreated leaves (virus free) of these plants were grafted onto 10-week-old healthy plants (20 plants with leaves of virus-treated plants and 20 plants with leaves of mock-treated plants) from which the tops were previously removed. The darker green shows that these plants generate a systemic signal that can be transmitted via grafting. Seeds derived from newly emerged tissues were collected and designated PI or PC plants. To show that this is the first progeny, these plants were named PI_1 and PC_1. To analyze changes in the next generation, these plants were propagated with and without TMV. The second generation of plants was obtained and named PI_2, PI_1_C1, and PC_2 as described in the text. These seeds were used to analyze HRF and stress tolerance. SRS, Systemic recombination signal. [See online article for color version of this figure.]
Figure 2.
Figure 2.
Increased frequency of recombination in the first progeny of infected plants. Spontaneous HRF was analyzed in the population of 50 to 100 plants taken from each of 10 independent progenies of both infected (PI_1) and mock-treated (PC_1) lines, and the analysis was repeated three times. The data shown are average numbers of spots per plant with sd The asterisk denotes a statistically significant difference between PC_1 and PI_1 plants (P < 0.05).
Figure 3.
Figure 3.
PI_1 plants exhibit a higher increase in HRF upon exposure to abiotic stress. PI_1 and PC_1 plants were germinated and grown for 1 week on sterile MS medium. At the age of 1 week, the plants were moved to MS plates containing various concentrations of either NaCl (A) or rose Bengal (RB; B). Recombination frequency was assayed at 3 weeks post germination. The data shown are average HRF (with sd) per single plant scored in a population of approximately 100 plants taken from each of 10 independent PI_1 and PC_1 lines. Asterisks denote significant differences in exposed plants as compared with control nonexposed plants: * P < 0.05, ** P < 0.01, *** P < 0.001.
Figure 4.
Figure 4.
PI_1 and PI_2 plants exhibit delayed symptoms and a lower viral titer upon TMV infection. Single leaves of 5-week-old PI_1 and PC_1 plants were infected with 200 ng of TMV (for details, see “Materials and Methods”). For analysis, 100 PC_1 plants (10 plants from each of 10 lines) and 360 PI_1 plants (20 plants from each of 18 different PI lines) were infected. The experiment was performed in three independent sets. Asterisks denote statistically significant differences: * P < 0.05, ** P < 0.01, *** P < 0.001. A, Symptoms were monitored daily, and the data for 5, 6, 7, 9, 12, and 15 dpi are presented. The graph shows the average percentage (from three independent experiments with sd) of plants with symptoms (out of the total number of infected plants). B, Virus concentrations were measured in infected plants at 6, 9, and 12 dpi. The graph depicts the average viral concentrations (from 18 different PI_1 lines and 10 different PC lines) as calculated from three independent repeats (in μg mL−1 TMV with sd). C, Spontaneous noninduced HRF analyzed in 3-week-old plants is shown as the average number of recombination events (from three independent experiments with sd) in a population of 100 to 200 plants (10–20 plants per individual line) in each experimental group. Statistical analysis was performed to identify differences between PI_1 and PC_1, PI_2, and PC_2 as well as PI_1_C1 and PC_2 plants. D, Single leaves of 5-week-old plants (20 plants per treatment) were infected with 200 ng of TMV. The viral titer was analyzed at 6, 9, 12, and 15 dpi. The graph shows the average viral concentrations as calculated from three independent experiments (in μg mL−1 TMV with sd). Statistical analysis was performed to identify differences between PI_1 and PC_1, PI_2, and PC_2 as well as PI_1_C1 and PC_2 plants.
Figure 5.
Figure 5.
PI_1 plants exhibit higher resistance to P. syringae and P. nicotianae. Plants were germinated on soil and infected with the pathogen either at 4 weeks (P. syringae) or 6 weeks (P. nicotianae) post germination. A, The number of bacterial colonies (with sd) recovered from infected PC_1 or PI_1 plants is shown (for details, see “Materials and Methods”). Asterisks represent significant differences between PC_1 and either PI_1 line (P < 0.05). B, Disease response of tobacco inoculated with an aggressive isolate of P. nicotianae. PC_1 plants (bottom row) exhibited significantly more symptoms of black shank disease than PI_1#9 plants (middle row) and PI_1#16 plants (top row). On the far right, uninoculated plants of each line are shown. [See online article for color version of this figure.]
Figure 6.
Figure 6.
Progeny of virus-infected plants exhibit higher tolerance to MMS. Plants were germinated on either normal medium or medium supplemented with 120 μL L−1 MMS. A, Representative phenotypes of plants grown with and without MMS are shown. B, Root length was measured at 2 weeks after exposure. The average root length (in cm with sd) of 20 plants (four plates with five plants in each) was calculated. Asterisks denote statistically significant differences as analyzed between PI_1 and PC_1, PI_2 and PC_1, or PI_1_C1 and PC_1 plants exposed to 120 μL L−1 MMS: ** P < 0.01, *** P < 0.001. [See online article for color version of this figure.]
Figure 7.
Figure 7.
PI plants exhibit methylation changes. A, Analysis of methylation using the cytosine extension assay. The data shown are percentages of methylation relative to methylation in PC_1 plants (with sd). Asterisks denote significant differences (P < 0.05). B, Analysis of methylation via immunohistochemistry using anti-5-methyl cytosine antibodies. The image depicts a cross-sectioned leaf at low magnification. Methylated cells are in red. C, The cell nucleus of PC_1 plants; different degrees of methylation in the center of the nucleus (red staining for methylated areas and blue staining for DNA) and at the periphery (the margin of the nucleus, mostly red) are observed. D, The cell nucleus of a PI_1 plant. E, The intensity of staining in the center of the nucleus was analyzed using ImageJ software. The data shown are average ratios (with sd) of 5-methyl cytosine (5-MeC) to DAPI staining in the cells of PI_1 and PC_1 plants. The asterisk indicates a significant difference between PI_1 and PC_1 plants (P < 0.05). [See online article for color version of this figure.]
Figure 8.
Figure 8.
PI_1 plants exhibit higher levels of PR1 expression than PC_1 plants. A, Northern-blot analysis of PR1 expression in PI_1#9, PI_#16, and PC_1 plants that were either infected with P. syringae or TMV or mock treated. Samples were taken at 24 and 48 hpi. Electrophoresis of total RNA from each sample is shown as a loading control. B, Quantification analysis of PR1 expression in TMV-infected samples (see A). The data shown are averages of four independent repetitions (in arbitrary units with sd). Asterisks denote significant differences between infected PI_1 plants and infected PC_1 plants: * P < 0.05, ** P < 0.01. C, Quantification analysis of PR1 expression in P. syringae-infected samples (see A). The data shown are averages of four independent repetitions (in arbitrary units with sd). Asterisks indicate significant differences between infected PI_1 plants and infected PC_1 plants: * P < 0.05, ** P < 0.01.
Figure 9.
Figure 9.
PI_1 plants show higher levels of callose deposition than PC_1 plants. A, Immunohistochemical staining for callose deposition (green fluorescence). Stained with DAPI, DNA appeared as blue fluorescence. Bars = 40 μm. B, Quantification of the intensity of callose-positive staining (with se; as in A). The data were analyzed in three independent experiments (three leaves from each of five plants). [See online article for color version of this figure.]

Similar articles

Cited by

References

    1. Alexander D, Goodman RM, Gut-Rella M, Glascock C, Weymann K, Friedrich L, Maddox D, Ahl-Goy P, Luntz T, Ward E, et al. (1993) Increased tolerance to two oomycete pathogens in transgenic tobacco expressing pathogenesis-related protein 1a. Proc Natl Acad Sci USA 90: 7327–7331 - PMC - PubMed
    1. Asselbergh B, De Vleesschauwer D, Hofte M. (2008) Global switches and fine-tuning-ABA modulates plant pathogen defense. Mol Plant Microbe Interact 21: 709–719 - PubMed
    1. Asurmendi S, Berg RH, Smith TJ, Bendahmane M, Beachy RN. (2007) Aggregation of TMV CP plays a role in CP functions and in coat-protein-mediated resistance. Virology 366: 98–106 - PMC - PubMed
    1. Baldwin IT, Schultz JC. (1983) Rapid changes in tree leaf chemistry induced by damage: evidence for communication between plants. Science 221: 277–279 - PubMed
    1. Balogun MA, Ramsay ME, Hesketh LM, Andrews N, Osborne KP, Gay NJ, Morgan-Capner P. (2002) The prevalence of hepatitis C in England and Wales. J Infect 45: 219–226 - PubMed

Publication types

MeSH terms

Substances

LinkOut - more resources