Comparative Study
. 2010 Jul 1;185(1):134-43.
doi: 10.4049/jimmunol.0803474. Epub 2010 May 24.

High expression of the ectonucleotidase CD39 on T cells from the inflamed site identifies two distinct populations, one regulatory and one memory T cell population

Affiliations
Comparative Study

High expression of the ectonucleotidase CD39 on T cells from the inflamed site identifies two distinct populations, one regulatory and one memory T cell population

Halima Moncrieffe et al. J Immunol. .

Abstract

The ectonucleotidase CD39 has recently been described as being highly expressed on regulatory Foxp3(+) CD4 T cells. Through hydrolysis of proinflammatory extracellular ATP, CD39 activity represents a newly described mechanism of regulatory T cell action. We report a novel population of human CD4 T cells that express CD39 yet are Foxp3 negative. These cells produce the proinflammatory cytokines IFN-gamma and IL-17 and fail to suppress proliferation; however, they still have high ATP hydrolysis activity. In the inflammatory site in human juvenile idiopathic arthritis, the CD39(+)Foxp3(-) population is greatly increased compared with peripheral blood of patients or healthy controls. We also show that cells expressing the AMPase CD73 are less frequent in the joint than in blood. To our knowledge, this is the first study to describe and characterize CD39 function on CD4 T cells from the target site in a human autoinflammatory condition. Our data suggest that in human CD4(+) T cells from the inflamed site, CD39 can be highly expressed on two populations, one regulatory and the other of a memory phenotype.


Figures

FIGURE 1
FIGURE 1
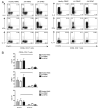
T cells from the inflamed joint express higher levels of CD39 than those from peripheral blood. CD39 expression was determined by flow cytometry in PBMCs from healthy control donors and patients with JIA and also SFMCs from the inflamed joint of patients with JIA. A, Data from healthy control PBMCs and, from the same patient, JIA PBMCs and JIA SFMCs. Top panel, dot plots show expression of CD39 and CD3 in one representative experiment of >15 of each sample. Middle and bottom panels, Histograms show CD39 expression on T cells gated on CD4, CD8, respectively. B, Bar graph shows proportion of CD39+ cells within total live population and within total CD3+ T cells and CD3+CD4+ and CD3+CD8+ T cell subsets. Bars represent the mean + SD. C, CD39 MFI of CD39+ cells within each population listed in B. B and C, Each bar represents the mean + SD of data from healthy control PBMCs, JIA PBMCs, JIA SFMCs (n = 7, 10, 7, respectively); horizontal bar represents p < 0.05. Total of 2.5 × 10⁴ each whole PBMCs or whole SFMCs (D) or mononuclear cells sorted by flow cytometry into CD39+ and CD39 populations (E) were assessed for ATPase activity with exogenous ATP added in the presence or absence of 100 μM ATPase inhibitor ARL67156 (ARL). ATP remaining at the end of the incubation was measured in light units. ATPase activity reduces ATP. Quantity of ATP is directly correlated with light units. Bar graphs represent the mean + SD of healthy control PBMCs, JIA PBMCs, and JIA SFMCs (D, n = 4, 8, 6, respectively; E, n = 4, 6, 3, respectively). F–H, E-ATP breakdown products were measured by HPLC. A total of 5 × 10⁴ cells were incubated with 25 μM E-ATP for 40 min at 37°C in the presence or absence of 100 μM ARL. F, Representative HPLC chromatograms showing E-ATP breakdown by healthy PBMCs sorted into CD39+ and CD39 populations (left and right panels, respectively) ± ARL (top and bottom panels, respectively). Each bar represents the mean + SD of data from healthy control PBMCs, JIA PBMCs, and JIA SFMCs (n = 3, 4, 4, respectively) unsorted (G) or sorted into CD39+ or CD39 cells (H).
FIGURE 2
FIGURE 2
CD39+ CD4 T cells have Foxp3+ and Foxp3 subpopulations. A, Foxp3 and CD39 expression in mononuclear cells was analyzed using flow cytometry. Data were gated on CD3+CD4+ cells (top panel) or CD3+CD8+ (bottom panel); dot plots show CD39 expression against Foxp3 expression for CD4 T cells of control PBMCs, JIA PBMCs, and SFMCs. Each are representative of >8 independent experiments with different donors. B, Scatter plot summarizing flow cytometry data shows percentage of CD4 T cells expressing CD39 and/or Foxp3. Mean values indicated by horizontal line are given for control PBMCs, JIA PBMCs, and JIA SFMCs (n = 16, 16, 20), respectively. C, Analysis of CD25 expression on CD39+ T cells. Left panel, Dot plot gated on CD4 T cells from a representative JIA SFMC sample. Right panel, Bar graph summarizing data from control PBMCs, JIA PBMCs, and JIA SFMCs (n = 13, 10, 9, respectively). Bars represent mean + SD. Horizontal bar represents p < 0.05.
FIGURE 3
FIGURE 3
Expression of other Treg markers on CD39+ CD4 T cells. A, Mononuclear cells were gated on CD3+CD4+ cells and analyzed for Treg surface markers CCR4 and CD127. Dot plot shown is gated on CD4 T cells from control PBMCs (one experiment representative of four) and the populations generated by Foxp3 and CD39 quadrants (i.e., CD39+Foxp3+, CD39+Foxp3, CD39Foxp3+, and CD39Foxp3, which are shown in histogram overlays showing expression of CCR4 [middle panel] and CD127 [right panel]). B, Bar graphs show data for percentage of CD4+CD39+Foxp3+ and CD4+CD39+Foxp3 T cells CCR4+ (left panel) and CD127lo (right panel) for healthy control PBMCs, JIA PBMCs, and JIA SFMCs (n = 5, 5, 5 and n = 5, 6, 5), respectively. Bars represent mean + SD. Horizontal lines represent differences between CD39+Foxp3+ and CD39+Foxp3 groups. p < 0.05.
FIGURE 4
FIGURE 4
CD39+ CD4 T cells may express proinflammatory cytokines. After short in vitro stimulation with PMA (50 ng/ml) and ionomycin (500 ng/ml), intracellular cytokine staining was performed for IL-2, IFN-γ, and IL-17 and cells costained for CD39 and Foxp3. Data were gated on CD4+ T cells and are representative of n = 5, 8, 6 (control PBMCs, JIA PBMCs, and JIA SFMCs, respectively) for each sample type. A, Dot plots showing cytokine production by CD39+ T cells (left panel) and CD39 T cells (right panel) for healthy PBMCs and PBMCs and SFMCs from the same patient with JIA. B, Bar graphs summarizing cytokine expression in CD39+Foxp3 and CD39+Foxp3+ cells. Data are percentage of respective cell population expressing IL-2 (top panel), IFN-γ (middle panel), or IL-17 (bottom panel) as labeled and expressed as mean + SEM. Horizontal lines represent differences between CD39+Foxp3 and CD39+Foxp3+ groups. p < 0.05.
FIGURE 5
FIGURE 5
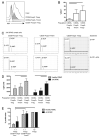
CD39+Foxp3 CD4 T cells do not suppress T cell proliferation. Mononuclear cell populations, healthy PBMCs or JIA SFMCs, were sorted to enrich for three CD4+ T cell populations, CD39+Foxp3+, CD39+Foxp3, and CD39Foxp3, using surface markers CD4+CD25hiCD127loCD39+, CD4+CD25loCD127hiCD39+, and CD4+CD25loCD127hiCD39, respectively. A, Healthy PBMCs were sorted to enrich for CD39+Foxp3+ Treg, CD39+Foxp3 Tmem, CD39Foxp3 Tresp CD4 T cell populations and stimulated in vitro with anti-CD3 and anti-CD28 for 7 d. Cell cycle progression was measured by flow cytometry for Ki67 as shown in histogram overlay (enriched for CD39+Foxp3+ Treg, front unshaded; CD39+Foxp3 Tmem; middle gray histogram; CD39Foxp3 Tresp, rear unshaded). B, Bar graph summarizing Ki67 data from five independent donors (n = 5). Bars represent mean + SD. C, E-ATP breakdown products were measured by HPLC. Total of 5 × 10⁴ cells were incubated in 25 μM E-ATP for 40 min at 37°C in the presence or absence of 100 μM ARL67156 (ARL). Representative HPLC graphs showing E-ATP breakdown by JIA SFMC sorted into populations enriched for CD39+Foxp3+ Treg (left panels), CD39+Foxp3 Tmem (middle panels), and CD39Foxp3 Tresp (right panels) without (top panels) or with ARL (bottom panels). Data show one experiment representative of three independent experiments. D, ATPase activity was assessed for each of the sorted populations by addition of exogenous ATP and luminometry. ATP remaining at the end of the incubation measured in light units. ATPase activity reduces ATP. For both healthy PBMCs and JIA SFMCs, n = 6, 6, respectively. Bars represent mean + SD. E, CD39+Foxp3+ Treg-enriched or CD39+Foxp3 Tmem-enriched cells were added in a 1:1 ratio with Tresps in standard proliferation assay. Proliferation was assessed using [3H]thymidine incorporation, and the CD39Foxp3 Tresp population was assigned as 100% proliferation. Proliferation was expressed as a percentage of Tresp proliferation. For both healthy PBMCs and JIA SMFCs, n = 4, 4, respectively. Bars represent mean + SEM. Horizontal lines represent group differences in proliferation compared with Tresps: CD39+Foxp3+; p < 0.05.

Similar articles

Cited by

References

    1. Hori S, Nomura T, Sakaguchi S. Control of regulatory T cell development by the transcription factor Foxp3. Science. 2003;299:1057–1061. - PubMed
    1. Wing K, Sakaguchi S. Regulatory T cells exert checks and balances on self tolerance and autoimmunity. Nat. Immunol. 2010;11:7–13. - PubMed
    1. Deaglio S, Dwyer KM, Gao W, Friedman D, Usheva A, Erat A, Chen JF, Enjyoji K, Linden J, Oukka M, et al. Adenosine generation catalyzed by CD39 and CD73 expressed on regulatory T cells mediates immune suppression. J. Exp. Med. 2007;204:1257–1265. - PMC - PubMed
    1. Borsellino G, Kleinewietfeld M, Di Mitri D, Sternjak A, Diamantini A, Giometto R, Höpner S, Centonze D, Bernardi G, Dell'Acqua ML, et al. Expression of ectonucleotidase CD39 by Foxp3+ Treg cells: hydrolysis of extracellular ATP and immune suppression. Blood. 2007;110:1225–1232. - PubMed
    1. Mandapathil M, Szczepanski MJ, Szajnik M, Ren J, Lenzner DE, Jackson EK, Gorelik E, Lang S, Johnson JT, Whiteside TL. Increased ectonucleotidase expression and activity in regulatory T cells of patients with head and neck cancer. Clin. Cancer Res. 2009;15:6348–6357. - PMC - PubMed

Publication types

MeSH terms