. 2010 Jul 23;285(30):23165-76.
doi: 10.1074/jbc.M109.084046. Epub 2010 May 24.

Arabidopsis synaptotagmin SYT1, a type I signal-anchor protein, requires tandem C2 domains for delivery to the plasma membrane

Affiliations

Arabidopsis synaptotagmin SYT1, a type I signal-anchor protein, requires tandem C2 domains for delivery to the plasma membrane

Tomokazu Yamazaki et al. J Biol Chem. .

Abstract

The correct localization of integral membrane proteins to subcellular compartments is important for their functions. Synaptotagmin contains a single transmembrane domain that functions as a type I signal-anchor sequence in its N terminus and two calcium-binding domains (C(2)A and C(2)B) in its C terminus. Here, we demonstrate that the localization of an Arabidopsis synaptotagmin homolog, SYT1, to the plasma membrane (PM) is modulated by tandem C2 domains. An analysis of the roots of a transformant-expressing green fluorescent protein-tagged SYT1 driven by native SYT1 promoter suggested that SYT1 is synthesized in the endoplasmic reticulum, and then delivered to the PM via the exocytotic pathway. We transiently expressed a series of truncated proteins in protoplasts, and determined that tandem C(2)A-C(2)B domains were necessary for the localization of SYT1 to the PM. The PM localization of SYT1 was greatly reduced following mutation of the calcium-binding motifs of the C(2)B domain, based on sequence comparisons with other homologs, such as endomembrane-localized SYT5. The localization of SYT1 to the PM may have been required for the functional divergence that occurred in the molecular evolution of plant synaptotagmins.


Figures
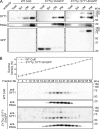
FIGURE 1.
FIGURE 1.
Immunoblot analysis of Arabidopsis plants expressing SYT1-EmGFP. A, purification of crude membrane vesicles. Seedlings of wild-type plants (Col0) and transgenic plants expressing EmGFP or SYT1-EmGFP under the SYT1 promoter (i.e. SYT1p::EmGFP or SYT1p::SYT1-EmGFP) were homogenized, and after centrifugation, supernatants were fractionated (Total) into soluble proteins and crude membrane vesicles. After ultracentrifugation, supernatants containing soluble proteins (Sol) and crude membrane vesicles (CM) were fractionated. From the CM fraction, plasma membrane vesicles (PM) were fractionated by the aqueous two-phase partition system. These fractions were separated by SDS-PAGE, and immunoblot analysis was performed using the anti-SYT1, which recognizes the C2A domain, anti-GFP and anti-PAQs, which recognizes total plasma membrane aquaporin, antibodies. Molecular mass is indicated to the right of the blot. B, separation of crude membrane vesicles from wild-type plants and the two transgenic plant seedlings using linear sucrose density gradient centrifugation. Sucrose densities of each fraction were measured (upper panel), and aliquots of each fraction were separated by SDS-PAGE and analyzed by immunoblotting with anti-SYT1 and anti-PAQ antibodies.
FIGURE 2.
FIGURE 2.
Topology and membrane integration of SYT1 and SYT1-EmGFP proteins. A, protease protection assay. The right-side-out plasma membrane vesicles were treated with various concentrations of a low specificity protease thermolysin. After digestion of the plasma membrane proteins, each sample was analyzed by immunoblotting with anti-SYT1 and anti-GFP antibodies. B, degradation pattern of plasma membrane-type H+-ATPase. After receiving the same treatment as the right-side-out plasma membrane vesicles in A, the degradation of the plasma membrane-type H+-ATPase was detected with anti-PMA2 antibody. C, membrane integration of SYT1 and SYT1-EmGFP. Two micrograms of crude membrane vesicle proteins isolated from seedlings of wild-type plants and transgenic plants expressing SYT1-EmGFP were treated with Na2CO3. After ultracentrifugation, the supernatant (Sup) and precipitate (Ppt) of each membrane sample were analyzed by immunoblotting with anti-SYT1, anti-GFP, and anti-PAQs antibodies. The separated proteins were also silver-stained.
FIGURE 3.
FIGURE 3.
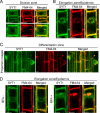
Localization of SYT1-EmGFP in root cells. GFP (green) and FM4–64 (red) emissions were observed in root cells using confocal fluorescence microscopy. Fluorescence images of dividing cells (A) and elongating cells (B). Projection images from optical sections of cells in differentiation zone (C). Root cells in the elongation zone were observed with or without 10 μm BFA (D). Bars indicate 10 μm.
FIGURE 4.
FIGURE 4.
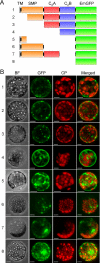
Localization of transiently expressed truncated SYT1-EmGFP proteins in protoplasts. A, schematics of truncated SYT1 with EmGFP (green box) in the C terminus. The TM, SMP, C2A, and C2B domains are represented as yellow, orange, red, and blue boxes, respectively. B, projection images generated from optical sections of EmGFP florescence in protoplasts expressed each truncated SYT1-EmGFP protein. Protoplasts transfected with the plasmid constructs containing the truncated SYT1-EmGFP described in panel A were observed using confocal fluorescence microscopy. The obtained images of each optical section of the protoplasts were reconstructed as projection images. BF, bright field; GFP, GFP fluorescence; CP, fluorescence of chlorophyll; Merged, merged image of GFP with CP. Bars indicate 10 μm.
FIGURE 5.
FIGURE 5.
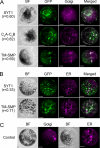
Localization of transiently expressed truncated SYT1-EmGFP proteins in ER- or Golgi-labeled protoplasts. A, SYT1-EmGFP and truncated SYT1-EmGFP proteins were transfected into protoplasts isolated from leaves of a transgenic plant expressing CFP-tagged Golgi marker proteins. B, co-localization analysis of SYT1-EmGFP or TM-SMP with ER-Tracker. C, CFP fluorescence in a transgenic plant expressing CFP-tagged Golgi marker and wild-type protoplasts stained with ER-Tracker. Projection images generated from optical sections of EmGFP florescence and CFP or ER-Tracker in protoplasts expressing full-length or truncated SYT1-EmGFP proteins. Emissions of EmGFP and CFP or ER-Tracker were observed using a confocal fluorescence microscope. The fluorescence images obtained from individual optical sections were reconstructed as projection images. SYT1, full-length SYT1; C2A-C2B, tandem C2A and C2B domains; TM-SMP, TM with SMP, BF, bright field; GFP, GFP fluorescence; Golgi, CFP fluorescence; ER, fluorescence of ER-Tracker; Merged, merged image of GFP with CFP or ER-Tracker. GFP fluorescence was pseudocolored green, and CFP or ER-Tracker fluorescence was pseudocolored magenta. Bars indicate 10 μm.
FIGURE 6.
FIGURE 6.
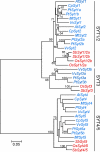
Phylogenetic tree Syts. Phylogenetic relationship between plant Syts was calculated using the neighbor-joining algorithm. Bootstrap support values on the tree branch are indicated. Based on the phylogenetic tree, three clades (i.e. SYT1/2, SYT3, and SYT4/5) were defined. Genes from monocots and eudicots are in red and blue, respectively. The bar shows the rate of nucleotide substitution.
FIGURE 7.
FIGURE 7.
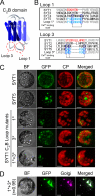
Localization of transiently expressed EmGFP-tagged SYT1, SYT5, and SYT1 proteins mutated at the C2B calcium-binding site in protoplasts. A, structural model of the SYT1 C2B domain. Diagrammatic representation of the C2B domain of SYT1 based on the prediction of putative β-strands in the C2 domains of eukaryotic synaptotagmin-related proteins by Jiménez and Davletov (16). Graduated-blue colored strips indicate putative β-strands. The strands are labeled in numerical order from the N terminus to the C terminus. B, comparison of the calcium-binding sites at Loop 1 and Loop 3. Amino acid sequences of SYT1, SYT2, SYT4, SYT5, and SYT1 mutants are aligned. Asterisks indicate amino acid residues of the conserved calcium-binding motifs. C, projections of optical sections of protoplasts. Transfected protoplasts were observed with confocal fluorescence microscopy. The optical sections were reconstructed as a projection image. GFP and autofluorescence of chlorophyll are green and red, respectively. D, colocalization analysis of SYT1 mutants containing both Loop 1* and Loop 3* in protoplasts isolated from the leaves of Golgi-labeled transgenic plants. GFP and CFP are green and magenta, respectively. BF, bright field; GFP, GFP fluorescence; CP, autofluorescence of chlorophyll; Golgi, CFP fluorescence of CFP-labeled Golgi marker proteins; Merged, merged image of GFP with CP or CFP. Bars indicate 10 μm.
FIGURE 8.
FIGURE 8.
Model of SYT1 delivery to the plasma membrane. SYT1 is synthesized on ER and delivered to PM through the exocytotic pathway. The default pathway of SYT1 is thought to be Golgi or TGN. Two tandem calcium-binding domains function as a determinant of PM localization and also the prevention of up-taking SYT1 to the endocytotic pathway. PM, plasma membrane; Golgi, Golgi apparatus; TGN, trans-Golgi network; ER, endoplasmic reticulum; EE, early endosome; LE, late endosome; MVB, multivesicular body.

Similar articles

Cited by

References

    1. Südhof T. C. (2002) J. Biol. Chem. 277, 7629–7632 - PubMed
    1. Bai J., Chapman E. R. (2004) Trends Biochem. Sci 29, 143–151 - PubMed
    1. Gustavsson N., Lao Y., Maximov A., Chuang J. C., Kostromina E., Repa J. J., Li C., Radda G. K., Südhof T. C., Han W. (2008) Proc. Natl. Acad. Sci. U.S.A. 105, 3992–3997 - PMC - PubMed
    1. Zhao H., Ito Y., Chappel J., Andrews N. W., Teitelbaum S. L., Ross F. P. (2008) Dev. Cell 14, 914–925 - PMC - PubMed
    1. Craxton M. (2004) BMC Genomics 5, 43. - PMC - PubMed

Publication types

MeSH terms

Substances