Glutathione synthesis and turnover in the human erythrocyte: alignment of a model based on detailed enzyme kinetics with experimental data
- PMID: 20498365
- PMCID: PMC2911318
- DOI: 10.1074/jbc.M109.067017
Glutathione synthesis and turnover in the human erythrocyte: alignment of a model based on detailed enzyme kinetics with experimental data
Abstract
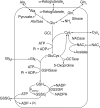
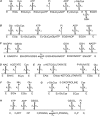
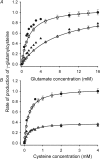
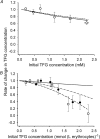
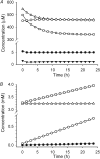
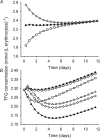
The erythrocyte is exposed to reactive oxygen species in the circulation and also to those produced by autoxidation of hemoglobin. Consequently, erythrocytes depend on protection by the antioxidant glutathione. Mathematical models based on realistic kinetic data have provided valuable insights into the regulation of biochemical pathways within the erythrocyte but none have satisfactorily accounted for glutathione metabolism. In the current model, rate equations were derived for the enzyme-catalyzed reactions, and for each equation the nonlinear algebraic relationship between the steady-state kinetic parameters and the unitary rate constants was derived. The model also includes the transport processes that supply the amino acid constituents of glutathione and the export of oxidized glutathione. Values of the kinetic parameters for the individual reactions were measured predominately using isolated enzymes under conditions that differed from the intracellular environment. By comparing the experimental and simulated results, the values of the enzyme-kinetic parameters of the model were refined to yield conformity between model simulations and experimental data. Model output accurately represented the steady-state concentrations of metabolites in erythrocytes suspended in plasma and the changing glutathione concentrations in whole and hemolyzed erythrocytes under specific experimental conditions. Analysis indicated that feedback inhibition of gamma-glutamate-cysteine ligase by glutathione had a limited effect on steady-state glutathione concentrations and was not sufficiently potent to return glutathione concentrations to normal levels in erythrocytes exposed to sustained increases in oxidative load.
Figures

Similar articles
-
Model of 2,3-bisphosphoglycerate metabolism in the human erythrocyte based on detailed enzyme kinetic equations: equations and parameter refinement.Biochem J. 1999 Sep 15;342 Pt 3(Pt 3):581-96. Biochem J. 1999. PMID: 10477269 Free PMC article.
-
Glutamine and α-ketoglutarate as glutamate sources for glutathione synthesis in human erythrocytes.FEBS J. 2011 Sep;278(17):3152-63. doi: 10.1111/j.1742-4658.2011.08241.x. Epub 2011 Aug 8. FEBS J. 2011. PMID: 21749648
-
[Mathematical modelling of glycolysis and adenine nucleotide metabolism of human erythrocytes. I. Reaction-kinetic statements, analysis of in vivo state and determination of starting conditions for in vitro experiments].Acta Biol Med Ger. 1981;40(12):1659-82. Acta Biol Med Ger. 1981. PMID: 6285649 German.
-
Regulation of cellular glutathione.Am J Physiol. 1989 Oct;257(4 Pt 1):L163-73. doi: 10.1152/ajplung.1989.257.4.L163. Am J Physiol. 1989. PMID: 2572174 Review.
-
New aspects of glutathione metabolism and translocation in mammals.Ciba Found Symp. 1979;(72):135-61. doi: 10.1002/9780470720554.ch9. Ciba Found Symp. 1979. PMID: 45011 Review.
Cited by
-
L-glutamine for sickle cell disease: Knight or pawn?Exp Biol Med (Maywood). 2020 Jan;245(2):146-154. doi: 10.1177/1535370219900637. Epub 2020 Jan 27. Exp Biol Med (Maywood). 2020. PMID: 31985279 Free PMC article. Review.
-
Structural and Mechanistic Insights into Hemoglobin-catalyzed Hydrogen Sulfide Oxidation and the Fate of Polysulfide Products.J Biol Chem. 2017 Mar 31;292(13):5584-5592. doi: 10.1074/jbc.M117.774943. Epub 2017 Feb 17. J Biol Chem. 2017. PMID: 28213526 Free PMC article.
-
Modulation of rat monocyte/macrophage innate functions by increasing intensities of swimming exercise is associated with heat shock protein status.Mol Cell Biochem. 2016 Oct;421(1-2):111-25. doi: 10.1007/s11010-016-2791-1. Epub 2016 Aug 13. Mol Cell Biochem. 2016. PMID: 27522667
-
Redox Properties of Human Erythrocytes Are Adapted for Vitamin C Recycling.Front Physiol. 2021 Dec 6;12:767439. doi: 10.3389/fphys.2021.767439. eCollection 2021. Front Physiol. 2021. PMID: 34938201 Free PMC article.
-
Efficient Cocaine Degradation by Cocaine Esterase-Loaded Red Blood Cells.Front Physiol. 2020 Sep 10;11:573492. doi: 10.3389/fphys.2020.573492. eCollection 2020. Front Physiol. 2020. PMID: 33013487 Free PMC article.
References
-
- Mak I. T., Stafford R., Weglicki W. B. (1994) Am. J. Physiol. 267, C1366–C1370 - PubMed
-
- Hsieh H. S., Jaffe E. R. (1975) in The Red Blood Cell (Surgenor D. M. ed) 2nd Ed., Academic Press, New York, 799–824
-
- Rice-Evans C. (1990) in Erythroid Cells (Harris J. R. ed), pp. 429–451, Plenum Press, New York
-
- Halliwell B., Gutteridge J. M. (2004) Free Radicals in Biology and Medicine, 3rd Ed., Oxford University Press, Oxford
-
- Pace B. S., Shartava A., Pack-Mabien A., Mulekar M., Ardia A., Goodman S. R. (2003) Am. J. Hematol. 73, 26–32 - PubMed
Publication types
MeSH terms
Substances
LinkOut - more resources
Full Text Sources
Other Literature Sources

