. 2010 Jul 23;285(30):23007-18.
doi: 10.1074/jbc.M109.095992. Epub 2010 May 24.

cAMP mediators of pulsatile insulin secretion from glucose-stimulated single beta-cells

Affiliations

cAMP mediators of pulsatile insulin secretion from glucose-stimulated single beta-cells

Olof Idevall-Hagren et al. J Biol Chem. .

Abstract

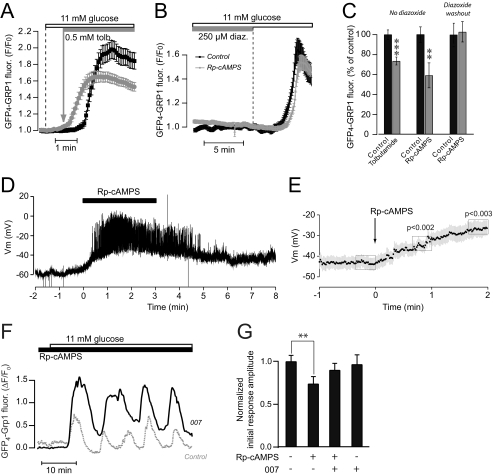
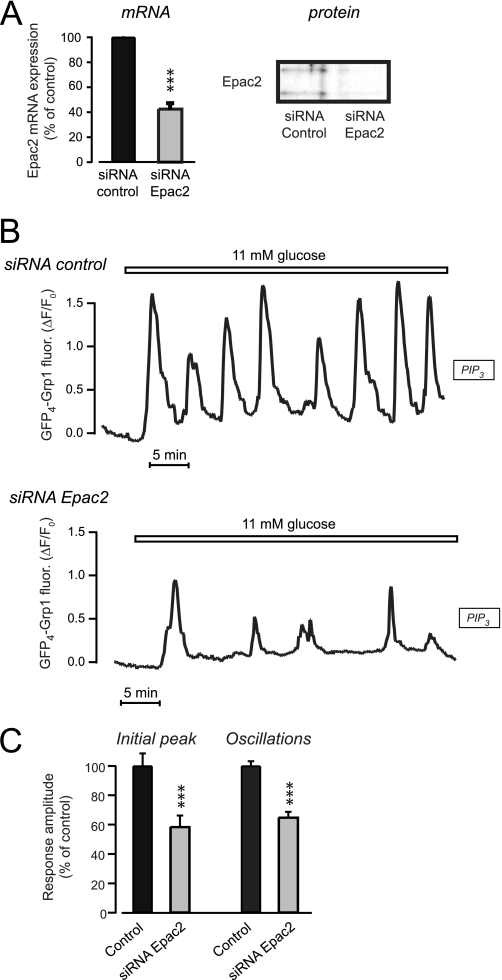
Pulsatile insulin release from glucose-stimulated beta-cells is driven by oscillations of the Ca(2+) and cAMP concentrations in the subplasma membrane space ([Ca(2+)](pm) and [cAMP](pm)). To clarify mechanisms by which cAMP regulates insulin secretion, we performed parallel evanescent wave fluorescence imaging of [cAMP](pm), [Ca(2+)](pm), and phosphatidylinositol 3,4,5-trisphosphate (PIP(3)) in the plasma membrane. This lipid is formed by autocrine insulin receptor activation and was used to monitor insulin release kinetics from single MIN6 beta-cells. Elevation of the glucose concentration from 3 to 11 mm induced, after a 2.7-min delay, coordinated oscillations of [Ca(2+)](pm), [cAMP](pm), and PIP(3). Inhibitors of protein kinase A (PKA) markedly diminished the PIP(3) response when applied before glucose stimulation, but did not affect already manifested PIP(3) oscillations. The reduced PIP(3) response could be attributed to accelerated depolarization causing early rise of [Ca(2+)](pm) that preceded the elevation of [cAMP](pm). However, the amplitude of the PIP(3) response after PKA inhibition was restored by a specific agonist to the cAMP-dependent guanine nucleotide exchange factor Epac. Suppression of cAMP formation with adenylyl cyclase inhibitors reduced already established PIP(3) oscillations in glucose-stimulated cells, and this effect was almost completely counteracted by the Epac agonist. In cells treated with small interfering RNA targeting Epac2, the amplitudes of the glucose-induced PIP(3) oscillations were reduced, and the Epac agonist was without effect. The data indicate that temporal coordination of the triggering [Ca(2+)](pm) and amplifying [cAMP](pm) signals is important for glucose-induced pulsatile insulin release. Although both PKA and Epac2 partake in initiating insulin secretion, the cAMP dependence of established pulsatility is mediated by Epac2.


Figures

FIGURE 1.
FIGURE 1.
Glucose triggers oscillations of [Ca2+]pm and [cAMP]pm that underlie pulsatile insulin release. A, evanescent wave microscopy recordings of PIP3 with GFP4-Grp1 (black trace, reflecting insulin secretion kinetics), [cAMP]pm with ΔRII-CFP-CaaX and Cα-YFP (green trace), and [Ca2+]pm with Fluo-4 (red trace) in three separate MIN6 β-cells. Elevation of the glucose concentration from 3 to 11 mm triggers oscillations in all three messengers. Images of GFP4-Grp1 fluorescence are from the time points indicated by the numbered arrowheads. B, simultaneous evanescent wave microscopy recordings of PIP3 with PHAkt-CFP (black trace), [cAMP]pm with Cα-YFP and a nonfluorescent ΔRII-CaaX (green trace), and [Ca2+]pm with Indo-1 (red trace) during stimulation of MIN6 cells with 20 mm glucose, showing coordinated increases of [Ca2+]pm and [cAMP]pm that precedes the increase of PIP3. C, imposed elevations of cAMP by intermittent application of 50 μm IBMX trigger pulsatile insulin secretion (n = 13).
FIGURE 2.
FIGURE 2.
PKA is involved in glucose initiation of insulin secretion. A, evanescent wave microscopy recording of pulsatile insulin release (PIP3 oscillations) from an individual GFP4-Grp1-expressing MIN6 β-cell stimulated by elevating the glucose concentration from 3 to 11 mm. B, suppression of the glucose-induced secretory response by 50 μm adenylyl cyclase inhibitor DDA (n = 17). C and D, effect of the PKA inhibitors Rp-8-CPT-cAMPS (100 μm, n = 35) (C) and KT5720 (2 μm, n = 19) (D) on the glucose-induced insulin secretory responses. E, means ± S.E. (error bars) of the effects of DDA and PKA inhibitors on the amplitude of the initial GFP4-Grp1 response induced by 11 mm glucose. All values are expressed relative to control (11 mm glucose). F and G, simultaneous evanescent wave microscopy recordings of PIP3 with GFP4-Grp1 (black traces) and [Ca2+]pm with Fura Red (dotted gray traces) in MIN6 β-cells depolarized with 30 mm KCl in the presence of 3 mm glucose under control conditions and after exposure to 100 μm Rp-8-CPT-cAMPS. Images were acquired every 2 s. The Fura Red traces have been inverted to show increases in [Ca2+]pm as upward deflections. H, means ± S.E. (error bars) of the amplitudes of the depolarization-induced GFP4-Grp1 translocation in the absence (n = 37) or presence of 100 μm Rp-8-CPT-cAMPS (n = 47) or 50 μm DDA (n = 20). I, 2 μm KT5720 (open symbols) and 100 μm Rp-8-CPT-cAMPS (gray symbols) were without effects on GFP4-Grp1 translocation induced by addition of 300 nm insulin (black symbols, control; n = 12–15 cells). *, p < 0.05; ***, p < 0.001 for difference from control.
FIGURE 3.
FIGURE 3.
PKA inhibition changes the timing of glucose-stimulated Ca2+ influx and insulin secretion but is without effect on the elevation of cAMP. A and B, wide-field epifluorescence microscopy recordings of [Ca2+]i in single MIN6 β-cells loaded with Fura-2 and stimulated by elevation of the glucose concentration from 3 to 11 mm in the absence (A) (n = 19) or presence (B) (n = 27) of 100 μm Rp-8-CPT-cAMPS. Representative single-cell traces are shown. C, means ± S.E. (error bars) of the glucose-induced [Ca2+]pm elevation detected with the low-affinity Ca2+ indicator Fluo-5F in the absence or presence of PKA inhibitors. D and E, simultaneous evanescent wave microscopy recordings of [Ca2+]pm with Fura Red (dotted gray traces) and PIP3 with CFP-PHAkt (black traces) during elevation of the glucose concentration from 3 to 11 mm in control MIN6 β-cells and those exposed to 100 μm Rp-8-CPT-cAMPS (added 5 min before the increase of glucose). The Fura Red traces have been inverted to show increases in [Ca2+]pm as upward deflections. F and G, simultaneous evanescent wave microscopy measurements of PIP3 with CFP-PHAkt (black traces) and [cAMP]pm with Cα-YFP and ΔRII-CaaX (dotted gray traces) after elevation of the glucose concentration from 3 to 11 mm in the absence (A) (n = 100) or presence (B) (n = 35) of 2 μm KT5720. The dashed lines have been included to visualize the delays between glucose stimulation and rise of [Ca2+]pm and [cAMP]pm in the absence and presence of PKA inhibitor. H, means ± S.E. (error bars) of the effect of 100 μm Rp-8-CPT-cAMPS on the initial PIP3 and [Ca2+]pm responses to glucose. I, means ± S.E. (error bars) of the effect of 2 μm KT5720 on the initial PIP3 and [cAMP]pm response amplitudes to glucose. J, correlation between the amplitude of the PIP3 response and the temporal relationship of the [cAMP]pm and PIP3 increases in the absence of PKA inhibitor. Average time differences for cells in which cAMP precedes (n = 59) or lags behind (n = 17) PIP3 by >10 s are plotted against the PHAkt-CFP response amplitude. *, p < 0.05 for difference from control; ***, p < 0.001 for difference from cells with cAMP behind.
FIGURE 4.
FIGURE 4.
Dissociation of the triggering Ca2+ and amplifying cAMP signals reduces glucose-induced insulin secretion. A, evanescent wave microscopy recordings from MIN6 cells expressing GFP4-Grp1. The cells were exposed to a rise of the glucose concentration from 3 to 11 mm in some cells followed by the addition of 0.5 mm tolbutamide after 1 min. The traces are means ± S.E. of 25 cells in one control experiment (black trace) and 27 cells exposed to tolbutamide in one experiment (gray trace). B, evanescent wave microscopy recordings from MIN6 cells expressing GFP4-Grp1. The cells were hyperpolarized with 250 μm diazoxide, exposed to 100 μm Rp-8-CPT-cAMPS (gray) or vehicle (black) followed by elevation of the glucose concentration from 3 to 11 mm and subsequent washout of diazoxide. Data are presented as means ± S.E. for 35 control cells and 28 cells exposed to Rp-8CPT-cAMPS. C, means ± S.E. (error bars) of the initial response amplitudes to 11 mm glucose in the absence (black) or presence (gray) of 0.5 mm tolbutamide, 100 μm Rp-8-CPT-cAMPS, or 100 μm Rp-8-CPT-cAMPS following washout of diazoxide. n = 30–85 cells. D, membrane potential recording from a single MIN6 β-cell within a small cell cluster exposed to 3 mm glucose. Rp-8-CPT-cAMPS (100 μm) was applied at t = 0 s as indicated. E, means ± S.E. from 14 recordings as shown in D. F, evanescent wave microscopy recording of PIP3 dynamics with GFP4-Grp1 during elevation of the glucose concentration from 3 to 11 mm in the presence of 100 μm Rp-8-CPT-cAMPS with (n = 40) or without (n = 31) preincubation for 10 min with the Epac-selective agonist 007. G, means ± S.E. (error bars) of the effects of Rp-8-CPT-cAMPS and 007 on the initial PIP3 response amplitude induced by 11 mm glucose. All values are normalized to the effect of 11 mm glucose alone, n = 31–53 cells. **, p < 0.01; ***, p < 0.001 for difference from control.
FIGURE 5.
FIGURE 5.
cAMP dependence of already established pulsatile insulin release in response to glucose is primarily mediated by Epac. A and B, evanescent wave microscopy recordings of glucose-stimulated PIP3 oscillations in a GFP4-Grp1-expressing MIN6 β-cell during inhibition of PKA with 2 μm KT5720 (A) (n = 35) or Rp-8-CPT-cAMPS (B) (n = 38). C, means ± S.E. (error bars) of the effect of different PKA inhibitors on the average PIP3 oscillation amplitudes. D and E, glucose-induced PIP3 responses are suppressed after inhibition of adenylyl cyclases with 50 μm DDA (D) (n = 39) or 400 μm SQ22536 (E) (n = 51), but in both cases the responses are partially restored by 1 μm Epac-selective activator 007-AM. F, means ± S.E. (error bars) of the effects of adenylyl cyclase inhibitors and 007-AM on the average PIP3 oscillation amplitude expressed in relation to the 11 mm glucose control. G, restoration of glucose-induced PIP3 oscillations in cells where the oscillations had spontaneously faded by application of 1 μm 007-AM (n = 10). ***, p < 0.001 compared with 11 mm glucose alone; #, p < 0.001 compared with 11 mm glucose + DDA and 007-AM.
FIGURE 6.
FIGURE 6.
Down-regulation of Epac2 expression suppresses glucose-induced pulsatile insulin secretion. A, Epac2 mRNA and protein expression in MIN6 cells detected with real-time PCR and Western blotting 24 h (mRNA) or 72 h (protein) after treatment with 100 nm siRNA targeted to Epac2 or luciferase as control. B, evanescent wave microscopy recording of membrane PIP3 concentration during elevation of the glucose concentration from 3 to 11 mm in single GFP4-Grp1-expressing MIN6 β-cells treated with 100 nm control (n = 82) or Epac2 siRNA (n = 72). C, means ± S.E. (error bars) of the amplitudes of the initial glucose-induced PIP3 peak and the average for the subsequent oscillations. ***, p < 0.001 for difference from control.
FIGURE 7.
FIGURE 7.
Model for the effect of PKA and Epac on glucose-induced pulsatile insulin secretion. Under control conditions, elevation of the glucose concentration triggers after a delay concomitant rises of [Ca2+]pm (red trace) and [cAMP]pm (black trace), which are followed by an increase of membrane PIP3 (green trace), reflecting the more pronounced initial peak of insulin secretion. During subsequent pulsatile secretion, [Ca2+]pm and [cAMP]pm elevations slightly precede the rises of PIP3. When PKA is inhibited, the initial delay for increase of [Ca2+]pm is shortened. Moreover, The Ca2+-triggered rise of PIP3 is less pronounced than under control conditions and occurs before the elevation of [cAMP]pm. In contrast, inhibition of PKA during manifested pulsatile secretion does not alter the responses. Inactivation of Epac does not affect the glucose-induced [Ca2+]pm and [cAMP]pm signals, but lowers the amplitude of both the first peak and the subsequent PIP3 responses.

Similar articles

Cited by

References

    1. Henquin J. C. (2000) Diabetes 49, 1751–1760 - PubMed
    1. Tengholm A., Gylfe E. (2009) Mol. Cell. Endocrinol. 297, 58–72 - PubMed
    1. Henquin J. C. (2009) Diabetologia 52, 739–751 - PubMed
    1. Bratanova-Tochkova T. K., Cheng H., Daniel S., Gunawardana S., Liu Y. J., Mulvaney-Musa J., Schermerhorn T., Straub S. G., Yajima H., Sharp G. W. (2002) Diabetes 51, Suppl. 1, S83–S90 - PubMed
    1. Rorsman P., Eliasson L., Renström E., Gromada J., Barg S., Göpel S. (2000) News Physiol. Sci. 15, 72–77 - PubMed

Publication types