. 2010 Jul 30;285(31):23711-20.
doi: 10.1074/jbc.M110.123174. Epub 2010 May 24.

Involvement of inducible 6-phosphofructo-2-kinase in the anti-diabetic effect of peroxisome proliferator-activated receptor gamma activation in mice

Affiliations

Involvement of inducible 6-phosphofructo-2-kinase in the anti-diabetic effect of peroxisome proliferator-activated receptor gamma activation in mice

Xin Guo et al. J Biol Chem. .

Abstract

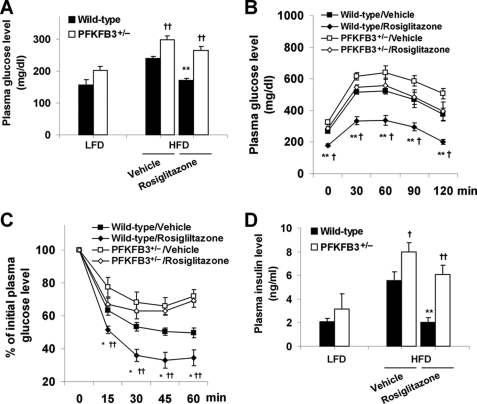
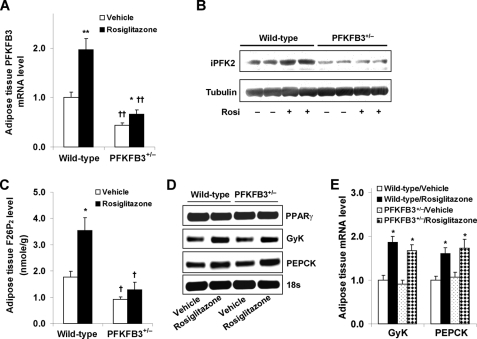
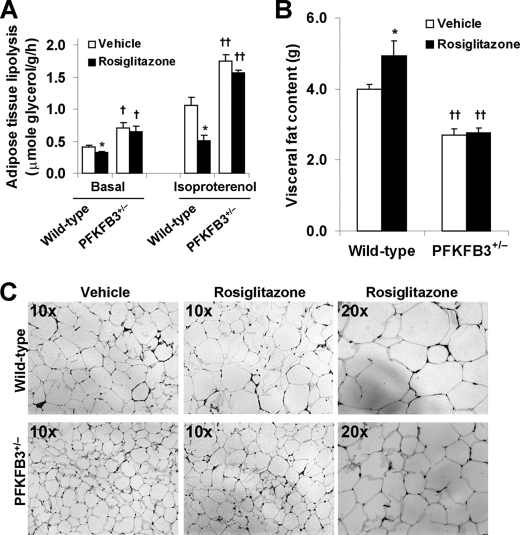
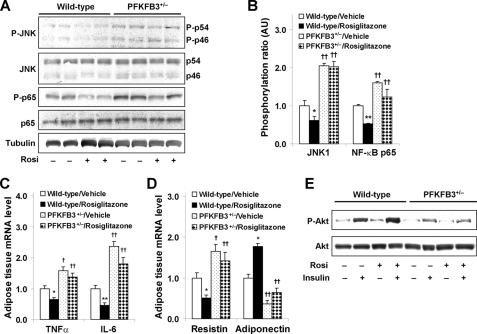
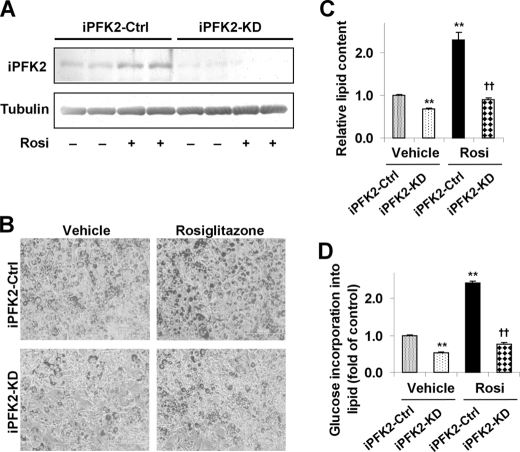
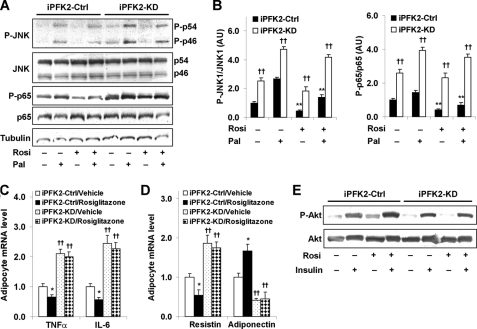
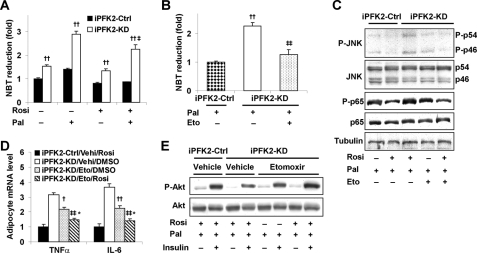
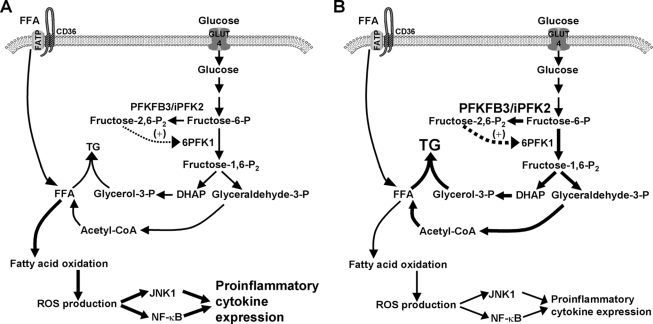
PFKFB3 is the gene that codes for the inducible isoform of 6-phosphofructo-2-kinase (iPFK2), a key regulatory enzyme of glycolysis. As one of the targets of peroxisome proliferator-activated receptor gamma (PPARgamma), PFKFB3/iPFK2 is up-regulated by thiazolidinediones. In the present study, using PFKFB3/iPFK2-disrupted mice, the role of PFKFB3/iPFK2 in the anti-diabetic effect of PPARgamma activation was determined. In wild-type littermate mice, PPARgamma activation (i.e. treatment with rosiglitazone) restored euglycemia and reversed high fat diet-induced insulin resistance and glucose intolerance. In contrast, PPARgamma activation did not reduce high fat diet-induced hyperglycemia and failed to reverse insulin resistance and glucose intolerance in PFKFB3(+/-) mice. The lack of anti-diabetic effect in PFKFB3(+/-) mice was associated with the inability of PPARgamma activation to suppress adipose tissue lipolysis and proinflammatory cytokine production, stimulate visceral fat accumulation, enhance adipose tissue insulin signaling, and appropriately regulate adipokine expression. Similarly, in cultured 3T3-L1 adipocytes, knockdown of PFKFB3/iPFK2 lessened the effect of PPARgamma activation on stimulating lipid accumulation. Furthermore, PPARgamma activation did not suppress inflammatory signaling in PFKFB3/iPFK2-knockdown adipocytes as it did in control adipocytes. Upon inhibition of excessive fatty acid oxidation in PFKFB3/iPFK2-knockdown adipocytes, PPARgamma activation was able to significantly reverse inflammatory signaling and proinflammatory cytokine expression and restore insulin signaling. Together, these data demonstrate that PFKFB3/iPFK2 is critically involved in the anti-diabetic effect of PPARgamma activation.


Figures

FIGURE 1.
FIGURE 1.
Disruption of PFKFB3/iPFK2 blunts the anti-diabetic effect of PPARγ activation. Male PFKFB3+/− mice and wild-type littermates, at the age of 5–6 weeks, were fed an HFD for 12 weeks and treated with rosiglitazone (10 mg/kg/day) or vehicle (PBS) during the last 4 weeks of HFD feeding. Data are means ± S.E. (error bars), n = 6. A, changes in the levels of plasma glucose. As the control, the age-matched male PFKFB3+/− mice and wild-type littermates were fed a low fat diet (LFD) and received no treatment. All of the mice were fasted for 4 h before collection of blood samples. **, p < 0.01, rosiglitazone versus vehicle within the same genotype. †, p < 0.05; ††, p < 0.01, PFKFB3+/− versus wild type on an HFD with the same treatment (rosiglitazone or vehicle). For B and C, mice were fasted for 4 h and received an intraperitoneal injection of d-glucose (2 g/kg) (B) or insulin (0.5 units/kg) (C). *, p < 0.05; **, p < 0.01, wild type/rosiglitazone versus wild type/vehicle. †, p < 0.05; ††, p < 0.01, PFKFB3+/−/rosiglitazone versus wild type/rosiglitazone. B, glucose tolerance test. C, insulin tolerance test. D, changes in the levels of plasma insulin. Mice were fed and/or treated as described in A. Statistical analyses were identical to those in A.
FIGURE 2.
FIGURE 2.
Disruption of PFKFB3/iPFK2 impairs the response of adipose tissue PFKFB3/iPFK2 but not other PPARγ target genes to PPARγ activation. At the age of 5–6 weeks, male PFKFB3+/− mice and wild-type littermates were fed an HFD for 12 weeks and treated with rosiglitazone (10 mg/kg/day) or vehicle (PBS) during the last 4 weeks of HFD feeding. At the end of the feeding/treatment regimen, mice were fasted for 4 h before collection of tissue samples. Epididymal adipose tissue samples were used for the analyses. A, the mRNA levels of PFKFB3 were measured using real-time RT-PCR. B, adipose tissue iPFK2 was determined using Western blot. C, adipose tissue F26P2 levels were determined using the 6-phosphofructo-1-kinase activation method. D, representative PCR products of adipose tissue genes. E, quantification of the expression of adipose tissue genes. Rosi, rosiglitazone. For A, C, and E, data are means ± S.E. (error bars), n = 6. *, p < 0.05; **, p < 0.01, rosiglitazone versus vehicle within the same genotype (in A and C) or wild type/rosiglitazone versus wild type/vehicle and PFKFB3+/−/rosiglitazone versus PFKFB3+/−/vehicle for the same gene (in E). †, p < 0.05; ††, p < 0.01, PFKFB3+/− versus wild type with the same treatment (rosiglitazone or vehicle in A and C).
FIGURE 3.
FIGURE 3.
Disruption of PFKFB3/iPFK2 lessens the effect of PPARγ activation on increasing adipose tissue fat storage. At the age of 5–6 weeks, male PFKFB3+/− mice and wild-type littermates were fed an HFD for 12 weeks and treated with rosiglitazone (10 mg/kg/day) or vehicle (PBS) during the last 4 weeks of HFD feeding. At the end of the feeding/treatment regimen, mice were fasted for 4 h before collection of tissue samples. For A and B, data are means ± S.E. (error bars), n = 6. *, p < 0.05 rosiglitazone versus vehicle within the same genotype (in A and B) in the presence of the same condition (in A, basal or isoproterenol). †, p < 0.05; ††, p < 0.01, PFKFB3+/− versus wild type with the same treatment (in A and B, rosiglitazone or vehicle) in the presence of the same condition (in A, basal or isoproterenol). A, the rates of adipose tissue lipolysis were measured under both basal and isoproterenol-stimulated conditions. B, visceral fat content was estimated from the sum of epididymal, mesenteric, and perinephric fat mass. C, adipose tissue histology. The sections of epididymal fat pad were stained with hematoxylin and eosin.
FIGURE 4.
FIGURE 4.
Disruption of PFKFB3/iPFK2 blunts the effects of PPARγ activation on suppression of HFD-induced adipose tissue inflammatory response and on reversal of adipose tissue dysfunction. At the age of 5–6 weeks, male PFKFB3+/− mice and wild-type littermates were fed an HFD for 12 weeks and treated with rosiglitazone (10 mg/kg/day) or vehicle (PBS) during the last 4 weeks of HFD feeding. At the end of the feeding/treatment regimen, mice were fasted for 4 h before the collection of tissue samples. Rosi, rosiglitazone. A, changes in inflammatory signaling were analyzed using Western blots. B, quantification of inflammatory signaling (arbitrary units). C, changes in adipose mRNA levels of TNFα and IL-6. D, changes in adipose mRNA levels of resistin and adiponectin. For B and D, data are means ± S.E. (error bars), n = 6. *, p < 0.05; **, p < 0.01, wild type/rosiglitazone versus wild type/vehicle for the same gene. †, p < 0.05; ††, p < 0.01 PFKFB3+/−/vehicle versus wild type/vehicle or PFKFB3+/−/rosiglitazone versus wild type/rosiglitazone for the same gene. For C and D, the expression of adipose tissue genes was measured using real-time RT-PCR. E, adipose tissue insulin signaling was analyzed using Western blot. Adipose tissue samples were collected at 5 min after a bolus injection of insulin (1 unit/kg) into the portal vein. P-p54, phospho-p54; P-p46, phospho-p46; P-Akt, phospho-Akt.
FIGURE 5.
FIGURE 5.
Knockdown of PFKFB3/iPFK2 lessens the effect of PPARγ activation on stimulating adipocyte lipid accumulation. After differentiation for 6–8 days, stable iPFK2-KD and iPFK2-Ctrl adipocytes were treated with rosiglitazone (Rosi; 1 μm) or vehicle (0.1% DMSO) for 48 h. Thereafter, the treated cells were subjected to the assays described under “Experimental Procedures.” A, adipocyte iPFK2 was determined using Western blot. B, representative images of adipocyte lipid content. Yellow bar, 500 μm. For C and D, data are means ± S.E. (error bars), n = 4. **, p < 0.01, iPFK2-KD/vehicle or iPFK2-Ctrl/rosiglitazone versus iPFK2-Ctrl/vehicle; ††, p < 0.01, iPFK2-KD/Rosi versus iPFK2-Ctrl/rosiglitazone. C, quantification of adipocyte lipid accumulation (arbitrary units). D, changes in the rate of glucose incorporation into lipid.
FIGURE 6.
FIGURE 6.
Knockdown of PFKFB3/iPFK2 diminishes the effects of PPARγ activation on both suppression of adipocyte inflammatory response and improvement of adipocyte function. After differentiation for 6–8 days, stable iPFK2-KD and iPFK2-Ctrl adipocytes were treated with rosiglitazone (Rosi; 1 μm) or vehicle (0.1% DMSO) for 48 h in the presence or absence of palmitate (Pal; 250 μm) for the last 24 h. Thereafter, the treated cells were subjected to the assays described under “Experimental Procedures.” A, changes in inflammatory signaling were analyzed using Western blots. For B–D, data are means ± S.E., n = 4. B, quantification of inflammatory signaling (arbitrary units). Left, phospho-JNK1 (P-JNK1)/JNK1; right, phospho-p65 (P-p65)/p65. **, p < 0.01, iPFK2-Ctrl treated with Rosi versus iPFK2-Ctrl treated without Rosi in the presence or absence of Pal. ††, p < 0.01, iPFK2-KD versus iPFK2-Ctrl under the same condition. For C and D, the expression of proinflammatory cytokines (C) and adipokines (D) was measured using real-time RT-PCR. *, p < 0.05, iPFK2-Ctrl/rosiglitazone versus iPFK2-Ctrl/vehicle for the same gene. ††, p < 0.01, iPFK2-KD/vehicle versus iPFK2-Ctrl/vehicle or iPFK2-KD/rosiglitazone versus iPFK2-Ctrl/rosiglitazone for the same gene. E, adipocyte insulin signaling was analyzed using Western blot. Before harvest, the cells were incubated with or without insulin (100 nm) for 30 min. P-p46, phospho-p46.
FIGURE 7.
FIGURE 7.
Inhibition of fatty acid oxidation restores the effects of PPARγ activation on both suppression of adipocyte inflammatory response and stimulation of adipocyte insulin signaling. After differentiation for 6–8 days, stable iPFK2-KD and iPFK2-Ctrl adipocytes were treated with rosiglitazone (Rosi; 1 μm) or vehicle (0.1% DMSO) for 48 h. In the last 24 h, the cells were incubated with or without etomoxir (Eto; 100 μm) in the presence or absence of palmitate (Pal; 250 μm) for 24 h. Thereafter, the treated cells were subjected to the assays described under “Experimental Procedures.” For A and B, the production of ROS was measured using the nitro blue tetrazolium assay. Data are means ± S.E. (error bars), n = 4. A, ††, p < 0.01, iPFK2-KD versus iPFK2-Ctrl under the same condition. ‡, p < 0.05, iPFK2-KD in the presence of palmitate versus iPFK2-KD in the absence of palmitate under treatment with rosiglitazone. B, ††, p < 0.01 iPFK2-KD versus iPFK2-Ctrl in the absence of etomoxir; ‡‡, p < 0.01 iPFK2-KD in the presence of etomoxir versus iPFK2-KD in the absence of etomoxir. C, changes in adipocyte inflammatory signaling. D, changes in adipocyte expression of proinflammatory cytokines. Data are means ± S.E. (error bars), n = 4. †, p < 0.05; ††, p < 0.01, iPFK2-KD/etomoxir/DMSO versus iPFK2-KD/vehicle (Vehi)/DMSO for the same gene. ‡‡, p < 0.01, iPFK2-KD/etomoxir/rosiglitazone versus iPFK2-KD/Vehi/DMSO; *, p < 0.05, iPFK2-KD/etomoxir/rosiglitazone versus iPFK2-KD/etomoxir/DMSO. E, changes in adipocyte insulin signaling. Before harvest, the cells were incubated with or without insulin (100 nm) for 30 min.
FIGURE 8.
FIGURE 8.
Involvement of PFKFB3/iPFK2 in the effects of PPARγ activation in adipocytes. Under the condition of overnutrition (A), adipocytes exhibit an increase in inflammatory response, which is brought about at least in part by excessive fatty acid oxidation. Upon activation of PPARγ (B), an increase in the expression of PFKFB3/iPFK2 enhances glycolysis to facilitate the synthesis of triglycerides (TG) via generating glycerol-3-phosphate and FFA (derived from acetyl-CoA following pyruvate oxidation). As a result, an increase in channeling FFA to triglyceride synthesis reduces fatty acid oxidation-associated production of ROS, thereby suppressing inflammatory signaling pathways through JNK1 and NF-κB and decreasing the expression of proinflammatory cytokines. DHAP, dihydroxyacetone phosphate; GLUT4, glucose transporter 4; FATP, fatty acid transport protein.

Similar articles

Cited by

References

    1. Lehmann J. M., Moore L. B., Smith-Oliver T. A., Wilkison W. O., Willson T. M., Kliewer S. A. (1995) J. Biol. Chem. 270, 12953–12956 - PubMed
    1. Berger J., Bailey P., Biswas C., Cullinan C. A., Doebber T. W., Hayes N. S., Saperstein R., Smith R. G., Leibowitz M. D. (1996) Endocrinology 137, 4189–4195 - PubMed
    1. Lebovitz H. E., Dole J. F., Patwardhan R., Rappaport E. B., Freed M. I. (2001) J. Clin. Endocrinol. Metab. 86, 280–288 - PubMed
    1. Phillips L. S., Grunberger G., Miller E., Patwardhan R., Rappaport E. B., Salzman A. (2001) Diabetes Care 24, 308–315 - PubMed
    1. Krentz A. J., Bailey C. J., Melander A. (2000) BMJ 321, 252–253 - PMC - PubMed

Publication types