. 2010 Jul;16(7):1340-9.
doi: 10.1261/rna.1837410. Epub 2010 May 24.

On the significance of an RNA tertiary structure prediction

Affiliations

On the significance of an RNA tertiary structure prediction

Christine E Hajdin et al. RNA. 2010 Jul.

Abstract

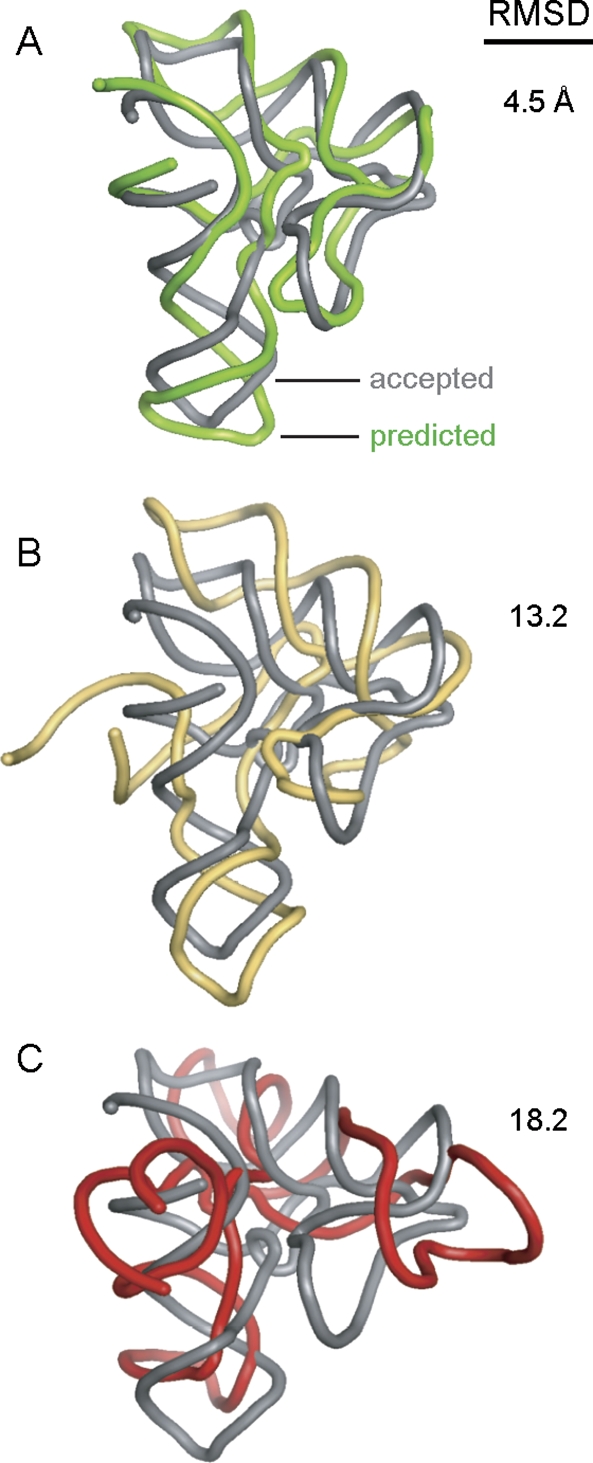
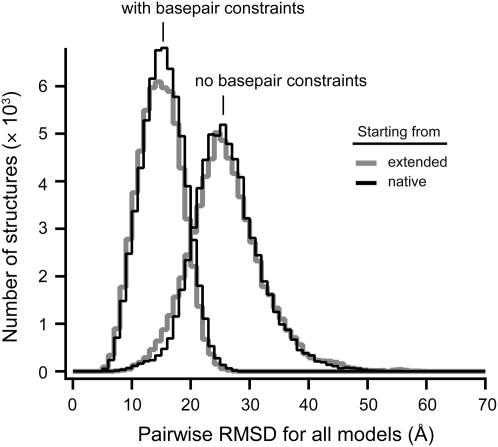
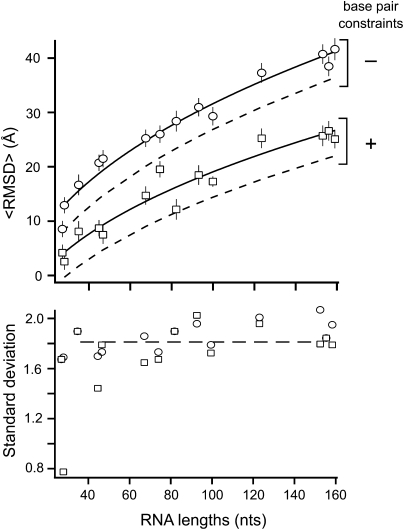
Tertiary structure prediction is important for understanding structure-function relationships for RNAs whose structures are unknown and for characterizing RNA states recalcitrant to direct analysis. However, it is unknown what root-mean-square deviation (RMSD) corresponds to a statistically significant RNA tertiary structure prediction. We use discrete molecular dynamics to generate RNA-like folds for structures up to 161 nucleotides (nt) that have complex tertiary interactions and then determine the RMSD distribution between these decoys. These distributions are Gaussian-like. The mean RMSD increases with RNA length and is smaller if secondary structure constraints are imposed while generating decoys. The compactness of RNA molecules with true tertiary folds is intermediate between closely packed spheres and a freely jointed chain. We use this scaling relationship to define an expression relating RMSD with the confidence that a structure prediction is better than that expected by chance. This is the prediction significance, and corresponds to a P-value. For a 100-nt RNA, the RMSD of predicted structures should be within 25 A of the accepted structure to reach the P <or= 0.01 level if the secondary structure is predicted de novo and within 14 A if secondary structure information is used as a constraint. This significance approach should be useful for evaluating diverse RNA structure prediction and molecular modeling algorithms.


Figures

FIGURE 1.
FIGURE 1.
Comparison of an accepted RNA structure with modeled tertiary structures as a function of RMSD similarity. The experimentally determined (Montange and Batey 2006) and simulated structures of the SAM riboswitch (94 nt, 2gis) are shown as gray and colored backbones, respectively (A–C).
FIGURE 2.
FIGURE 2.
Replica exchange DMD simulations as a function of starting state and of enforcing native base pairing. Simulations were initiated either from the crystallographic structure or from a linear, extended state for the purine riboswitch (67 nt, 1u8d) (Batey et al. 2004).
FIGURE 3.
FIGURE 3.
Distributions of decoy structures. RNA decoy structures were stimulated using replica exchange DMD starting from fully extended linear structures either without or with constraints that enforce the native pattern of base pairing (solid gray lines). Distributions show good Gaussian-like behavior (dashed lines). RNAs shown are a viral RNA pseudoknot (28 nt), the purine riboswitch (67 nt), and the specificity domain of RNase P (155 nt) (Egli et al. 2002; Krasilnikov et al. 2003; Batey et al. 2004; Gherghe et al. 2008). Standard deviations are ∼1.8 ± 0.3 Å in all cases, with the exception of the narrower distribution for the 28-nt pseudoknot RNA with base-pair constraints.
FIGURE 4.
FIGURE 4.
Dependence of radius of gyration on chain length for compact RNAs with higher-order tertiary structure interactions. Fits to the 0.33 and 0.60 exponents (but not to the 0.41 exponent) show systematic deviations from the points.
FIGURE 5.
FIGURE 5.
Mean pairwise RMSD as a function of RNA chain length. Decoy structures either constrained to form base pairs found in the experimentally determined native structure or allowed to form any energetically favorable set of base pairs are shown. Solid lines correspond to distributions expected for RNA-like, but chance, folds. Dashed lines indicate the RMSD cutoff corresponding to a prediction better than that expected by chance at the P < 0.01 level. Lines indicate fits to the power-law relationship 〈RMSD〉 ≈ a N0.41-b ; a and b values are given in Box 1. The mean and standard deviation for each distribution are shown with symbols and error bars.
FIGURE 6.
FIGURE 6.
Use of P-values to benchmark RNA tertiary structure models. (A) Spheres represent P-values for seven models (indicated with Mx) of tRNAAsp based on experimentally derived tertiary structure information, refined by DMD (Gherghe et al. 2009). (Squares) P-values for three refinements (indicated with Nx) of tRNA using a one-bead model for RNA and filtering by hydroxyl radical and SAXS data using the NAST program (Jonikas et al. 2009). P-values for comparison of tRNAAsp (2tra, 75 nt) (Westhof et al. 1988) with two unrelated RNAs of similar size, the HDV ribozyme (1vby, 76 nt) (Ke et al. 2004), and the Thi-box riboswitch (3d2g, 77 nt) (Thore et al. 2008), plus tRNAAsp as it exists when bound by its synthetase (1asy) (Ruff et al. 1991), are shown as a horizontal bar and a filled circle, respectively. RMSDs are calculated over all phosphate positions with the exception of the NAST models, which correspond to the C3′ atom. (B) Comparison of RMSD and GDT-TS values for the seven Mx tRNA models (open circles), plus the comparison between the 2tra and 1asy structures (filled circle).

References

    1. Badorrek CS, Gherghe CM, Weeks KM 2006. Structure of an RNA switch that enforces stringent retroviral genomic RNA dimerization. Proc Natl Acad Sci 103: 13640–13645 - PMC - PubMed
    1. Batey RT, Gilbert SD, Montange RK 2004. Structure of a natural guanine-responsive riboswitch complexed with the metabolite hypoxanthine. Nature 432: 411–415 - PubMed
    1. Berman HM, Westbrook J, Feng Z, Gilliland G, Bhat TN, Weissig H, Shindyalov IN, Bourne PE 2000. The Protein Data Bank. Nucleic Acids Res 28: 235–242 - PMC - PubMed
    1. Cohen F, Sternberg MJE 1980. On the prediction of protein structure: The significance of the root-mean-square deviation. J Mol Biol 138: 321–333 - PubMed
    1. Das R, Baker D 2007. Automated de novo prediction of native-like RNA tertiary structures. Proc Natl Acad Sci 104: 14664–14669 - PMC - PubMed

Publication types