. 2010 Jul 22;29(29):4170-82.
doi: 10.1038/onc.2010.170. Epub 2010 May 24.

Evidence for mesenchymal-like sub-populations within squamous cell carcinomas possessing chemoresistance and phenotypic plasticity

Affiliations

Evidence for mesenchymal-like sub-populations within squamous cell carcinomas possessing chemoresistance and phenotypic plasticity

D Basu et al. Oncogene. .

Abstract

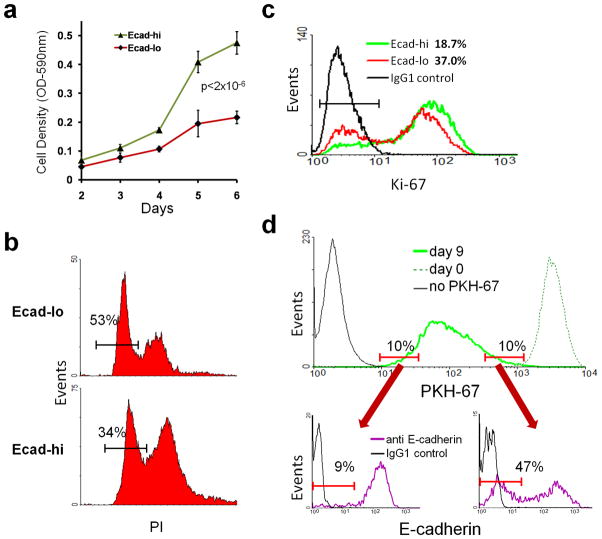
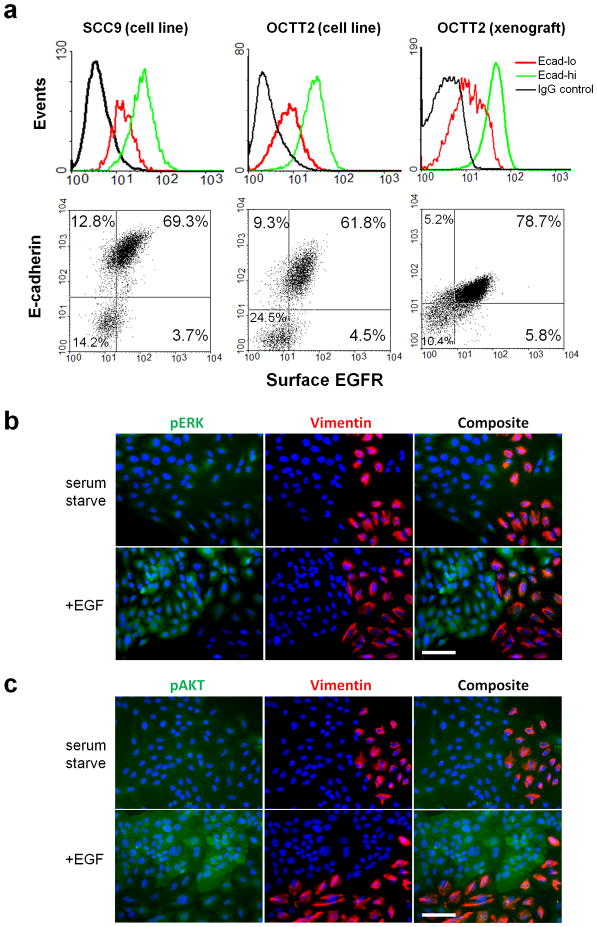
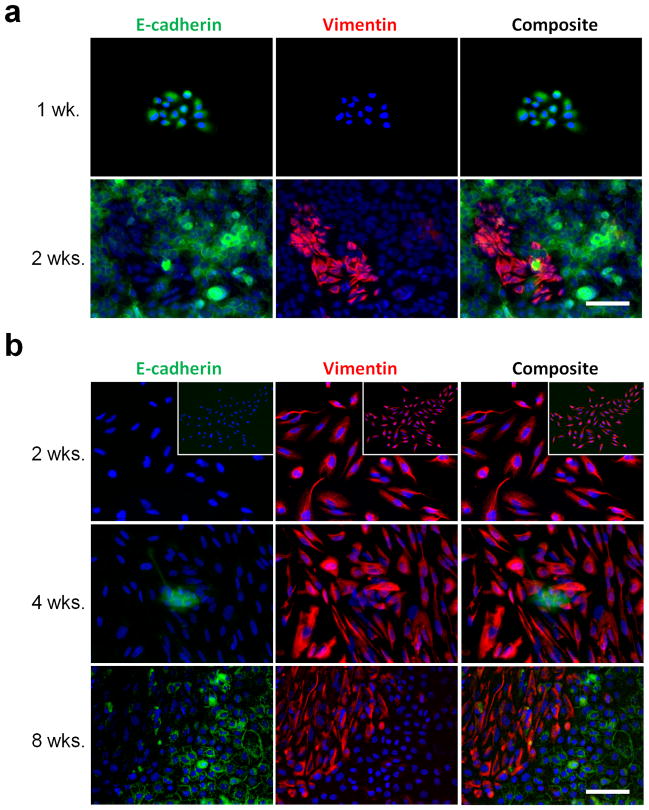
Variable drug responses among malignant cells within individual tumors may represent a barrier to their eradication using chemotherapy. Carcinoma cells expressing mesenchymal markers resist conventional and epidermal growth factor receptor (EGFR)-targeted chemotherapy. In this study, we evaluated whether mesenchymal-like sub-populations within human squamous cell carcinomas (SCCs) with predominantly epithelial features contribute to overall therapy resistance. We identified a mesenchymal-like subset expressing low E-cadherin (Ecad-lo) and high vimentin within the upper aerodigestive tract SCCs. This subset was both isolated from the cell lines and was identified in xenografts and primary clinical specimens. The Ecad-lo subset contained more low-turnover cells, correlating with resistance to the conventional chemotherapeutic paclitaxel in vitro. Epidermal growth factor induced less stimulation of the mitogen-activated protein kinase and phosphatidylinositol-3-kinase pathways in Ecad-lo cells, which was likely due to lower EGFR expression in this subset and correlated with in vivo resistance to the EGFR-targeted antibody, cetuximab. The Ecad-lo and high E-cadherin subsets were dynamic in phenotype, showing the capacity to repopulate each other from single-cell clones. Taken together, these results provide evidence for a low-turnover, mesenchymal-like sub-population in SCCs with diminished EGFR pathway function and intrinsic resistance to conventional and EGFR-targeted chemotherapies.


Conflict of interest statement

Conflict of Interest

All authors declare no conflict of interest.

Figures

Figure 1
Figure 1. Distinct epithelial and mesenchymal-like subpopulations in vitro and in vivo
(a) Phase contrast (10x) of heterogeneity in SCC9 and OCTT2 lines (left panels); IF (20x) of SCC9 and OCTT2 lines stained for 4′,6-diamidino-2-phenylindole (DAPI, blue), E-cadherin (green), and vimentin (red) (right panels). Fields were selected to contain both subpopulations in equal proportion. Bar=100μm. (b) SCC9 and OCTT2 cell lines segregated by FACS into Ecad-hi and Ecad-lo subsets (top panels); sorted subsets were then permeabilized and compared for vimentin staining using FC (bottom panels). (c) Gene expression profiling compares Ecad-hi vs. Ecad-lo subpopulations in SCC9 and OCTT2 lines. Expression of genes up-regulated (left panel) or down-regulated (right panel) during EMT is displayed as fold-change in Ecad-lo relative to Ecad-hi cells. (d) Dual label IHC for E-cadherin (brown) and vimentin (purple) in xenografts of SCC9 cells (left), the clinical HNSCC specimen from which the OCTT2 line was derived (middle), and xenografts of that clinical specimen (right) (40x, top row); corresponding digital pseudo-color images (bottom row), in which E-cadherin is green and vimentin is red. SCC9 xenografts were grown for 5–6 weeks after subcutaneous injection. OCTT2 xenografts were grown for 3 weeks post-implantation. Sections are representative of at least 4 mice analyzed per group. Data in (a) and (b) represent at least 3 independent experiments.
Figure 2
Figure 2. Reduced proliferation in the mesenchymal-like subset
(a) SCC9 cells were sorted into Ecad-hi and Ecad-lo subpopulations, and growth of each was measured by MTT assay. (b) Percentage of each subpopulation in G0/G1 phase, quantified by PI staining. (c) Percentage of each subpopulation in G0 phase, compared using FC of Ki-67 staining. (d) SCC9 cells were labeled with PKH-67, and uniform labeling was confirmed by FC at day 0 (top panel, dashed line). After growth for 9 days, cells were reanalyzed to determine the distribution of PKH-67 fluorescence (solid green line). The size of the Ecad-lo subset was compared between the 10% of cells with lowest PKH-67 label retention (left lower panel) versus the 10% of cells with highest label retention (right lower panel). Data are representative of 3 independent experiments.
Figure 3
Figure 3. Intrinsic paclitaxel resistance in the mesenchymal-like subset
(a) Ecad-hi and Ecad-lo subpopulations of SCC9/OCTT2 cells were treated with paclitaxel for 4 hours. Drug-induced growth inhibition is shown 72 hours later by MTT assay. (b) SCC9 cells were exposed to 100nM paclitaxel for 4 hrs. After 72 hours, the percentage of Ecad-lo cells among total viable cells pre vs. post-drug treatment is compared by FC (left and second panel). Cells surviving paclitaxel were sorted into Ecad-hi and Ecad-lo subsets and analyzed for vimentin expression (third panel). The percentage of Ecad-lo cells present after 48 continuous hours of paclitaxel exposure was also measured (right panel). (c) The same subsets treated with paclitaxel for 4 hours were compared against untreated controls for clonogenicity (left) and total growth after 72 hours (right) by MTT. (d) SCC9 cells treated with 100nM paclitaxel or DMSO control for 4 hours were observed by video microscopy in the presence of PI. Representative still images at 0, 24, and 48 hours (20x) after treatment identify cell death with PI uptake (red). Yellow lines encompass areas of mesenenchymal-like morphology. Data in (a)–(c) are representative of 3 independent experiments.
Figure 4
Figure 4. Diminished EGFR expression and regulation of MAPK/PI3K pathways in the mesenchymal like subset
(a) Ecad-hi vs. Ecad-lo SSC9 cells (left panels) and OCTT2 cells (middle panels) were analyzed by FC for surface EGFR expression. Surface EGFR levels are compared between subpopulations in tumor cells purified from xenografts of the OCTT2 clinical specimen (right panels). (b,c) IF (20x) of serum-starved SCC9 cells, with or without added 200ng/ml EGF, stained for DAPI (blue), vimentin (red), and either pERK (green, panel C) or pAKT (green, panel D). Results are representative of 3 independent experiments. Bars=100μm.
Figure 5
Figure 5. Intrinsic resistance to cetuximab in the mesenchymal-like subpopulation
(a) Growth inhibition of Ecad-hi and Ecad-lo subpopulations in SCC9 and OCTT2, measured by MTT assay after 72 hours cetuximab treatment. Data represent 3 independent experiments. (b) Xenografts were established of the human tumor from which the OCTT2 line originated, and mice with 100mm3 tumors were treated with 1mg cetuximab every 3 days for 4 doses. Tumor volume is plotted in comparison to saline-injected controls (n=4/group). (c) Cetuximab-treated and control tumors harvested after 12 days treatment were stained using dual label IHC (first row, 40x) for E-cadherin (brown) and vimentin (purple). Pseudo-color images (second row) show E-cadherin in green and vimentin in red. Vim-hi and vim-lo zones in wide areas of dual IHC-stained tumors (third row, 20x) were mapped in red and green, respectively, with exclusion of stromal areas and nuclei from analysis (fourth row). (d) Relative percentages of vim-hi versus vim-lo areas quantified in treated versus untreated tumors (n=4/group).
Figure 6
Figure 6. Dynamic reversibility of epithelial and mesenchymal-like phenotypes at a clonal level
(a) Ecad-hi SCC9 cells were plated at clonal dilution, and wells containing single colonies with pure epithelial morphology are identified after 1 week (top, 20x) by staining for DAPI (blue), E-cadherin (green), and vimentin (red). Similar morphologically pure colonies were expanded and then stained at 2 weeks (bottom). (b) Ecad-lo SCC9 cells were plated at clonal dilution, and wells containing isolated colonies with pure mesenchymal-like morphology are identified at 2 weeks and stained as in (a) (top row; 20x, inset 10x). Comparable colonies were expanded until epithelial areas initially appeared at 4 weeks (middle row) or fully repopulated after 8 weeks (bottom row). Bars=100μm.

References

    1. Adam L, Zhong M, Choi W, Qi W, Nicoloso M, Arora A, et al. miR-200 expression regulates epithelial-to-mesenchymal transition in bladder cancer cells and reverses resistance to epidermal growth factor receptor therapy. Clin Cancer Res. 2009;15:5060–72. - PMC - PubMed
    1. Ansieau S, Bastid J, Doreau A, Morel AP, Bouchet BP, Thomas C, et al. Induction of EMT by twist proteins as a collateral effect of tumor-promoting inactivation of premature senescence. Cancer Cell. 2008;14:79–89. - PubMed
    1. Bianco R, Troiani T, Tortora G, Ciardiello F. Intrinsic and acquired resistance to EGFR inhibitors in human cancer therapy. Endocr Relat Cancer. 2005;12(Suppl 1):S159–71. - PubMed
    1. Bonner JA, Harari PM, Giralt J, Azarnia N, Shin DM, Cohen RB, et al. Radiotherapy plus cetuximab for squamous-cell carcinoma of the head and neck. N Engl J Med. 2006;354:567–78. - PubMed
    1. Cano A, Perez-Moreno MA, Rodrigo I, Locascio A, Blanco MJ, del Barrio MG, et al. The transcription factor snail controls epithelial-mesenchymal transitions by repressing E-cadherin expression. Nat Cell Biol. 2000;2:76–83. - PubMed

Publication types