. 2010 Sep;90(9):1295-305.
doi: 10.1038/labinvest.2010.100. Epub 2010 May 24.

Toll-like receptor 4 differentially regulates epidermal growth factor-related growth factors in response to intestinal mucosal injury

Affiliations

Toll-like receptor 4 differentially regulates epidermal growth factor-related growth factors in response to intestinal mucosal injury

David Hsu et al. Lab Invest. 2010 Sep.

Abstract

Epiregulin (EPI) and amphiregulin (AR) are epidermal growth factor receptor (EGFR) ligands implicated in mucosal repair and tumorigenesis. We have shown that Toll-like receptor 4 (TLR4) induces intestinal epithelial cell (IEC) proliferation by activating EGFR through AR expression. We examined whether TLR4 differentially regulates expression of EGFR ligands in response to mucosal injury. The human IEC line SW480 was examined expression of EGFR ligands, EGFR phosphorylation, and proliferation in response to lipopolysaccharide (LPS). Small-interfering RNA (siRNA) was used to block TLR4. Neutralizing antibodies to EGFR ligands were used to examine inhibition of LPS-dependent EGFR activation. Acute colitis and recovery were examined in the mice given 2.5% dextran sodium sulfate (DSS). Colonic secretion of EPI and AR was analyzed by enzyme-linked immunosorbent assay. LPS selectively induces EPI and AR but not other EGFR ligands. LPS induced early EPI mRNA expression between 30 min and 24 h. The neutralizing antibodies to EPI and AR prevented activation of EGFR by LPS. LPS induces IEC proliferation (200%, P=0.01) in 24 h but blocking EPI and AR significantly decreased proliferation. In vivo, mucosal EPI and AR expression are significantly decreased in TLR4(-/-) mice (P=0.02) compared to wild-type mice during acute colitis. EPI and AR exhibit different kinetics in response to mucosal damage: EPI expression is upregulated acutely at day 7 of DSS, but falls during recovery at day 14. By contrast, a sustained upregulation of AR expression is seen during mucosal injury and repair. We show that TLR4 regulates EPI and AR expression and that both these EGFR ligands are necessary for optimal proliferation of IEC. The diverse kinetics of EPI and AR expression suggest that they function in distinct roles with respect to acute injury vs repair. Our results highlight the role of bacterial sensing for IEC homeostasis and may lead to targeted therapy for mucosal healing and prevention of tumorigenesis.


Conflict of interest statement

DISCLOSURE/CONFLICT OF INTEREST

The authors declare no conflict of interest.

Figures

Figure 1
Figure 1
TLR4 induces expression of epiregulin. (a) mRNA expression of EGFR ligands from human IEC SW480 in response to LPS. Agarose gel electrophoresis of real-time (RT)–PCR products from IECs (SW480 cells) stimulated with LPS (100 ng/ml) for 18 h. Expression of EGFR ligands is indicated. The graph (right) shows NF-κB activation by LPS stimulation as signaling control. Certain response is shown. (b) SW480 cells were stimulated with LPS (2 μg/ml) for indicated times. SYBR Green RT–PCR shows LPS-induced expression of epiregulin mRNA with a peak at 4 h of stimulation and a significant drop after 24 h when compared to 4 h. Data are represented as mean±s.e.m. of relative values of expression in three individual experiments of triplicate samples (*P<0.05). (c) TLR4-dependent induction of epiregulin in response to LPS. SW480 cells were stimulated in the presence or absence of LPS (2 μg/ml) for 4 h and co-transfected with either TLR4 siRNA or negative control siRNA. RT–PCR showed LPS-induced expression of epiregulin in negative control siRNA samples treated with LPS. This induction of epiregulin by LPS was largely abolished in the cells in which TLR4 was blocked with siRNA, indicating a TLR4-dependent pathway. Data are represented as mean±s.e.m. of relative values of expression in three individual experiments with triplicate samples (*P<0.05). Extent of TLR4 suppression by siRNA (upper right panel). SW480 cells were transiently transfected with siRNA against TLR4 or Negative siRNA, which has no significant homology to any gene sequences, was applied as a control. The knockdown efficiency of siRNA against TLR4 was assessed by western blot analysis. The siRNA decreased TLR4 protein expression. Negative siRNA did not affect TLR4 protein expression. (d) LPS induced epiregulin and amphiregulin protein expression in different kinetics. (Top panel) SW480 cells were stimulated in the presence LPS (2 μg/ml) for 30 min, 4 h, and 24 h. Blots of whole-cell lysates (25 μg per lane) were probed sequentially for the active form for epiregulin. β-Actin was used as an internal control for protein loading. The data are one representative experiment of three with similar results. (Bottom panel) SW480 cells were stimulated in the presence LPS (2 μg/ml) for 4, 24, and 48 h. Cell supernatants were measured concentration of amphiregulin by ELISA. (e) Epiregulin and amphiregulin mRNA expression in response to TLR ligands by RT–PCR. SW480 cells were stimulated with Pam3CSK4 (TLR2 ligand), polyI:C (TLR3 ligand), and LPS at a concentration of 100 ng/ml for 24 h. Expression of epiregulin, amphiregulin, and GADPH was examined by RT–PCR. The data are one representative experiment of three with similar results.
Figure 2
Figure 2
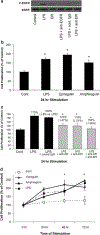
TLR4 induces EGFR phosphorylation and cell proliferation through epiregulin expression. (a) LPS-mediated activation of EGFR is epiregulin and amphiregulin dependent. SW480 cells were stimulated with LPS (2 μg/ml) for 30 min or treated with exogenous epiregulin (40 ng/ml). SW480 cells were pretreated with neutralizing antibodies to the ligandbinding site of EGFR, and/or amphiregulin, or control immunoglobulin G for 2 h. Blots of whole-cell lysates (25 μg per lane) were probed sequentially for phospho-EGFR or EGFR. β-Actin was used as an internal control for protein loading. The data are one representative experiment of three with similar results. (b) LPS, epiregulin, and amphiregulin induce cell proliferation. SW480 cells were stimulated with LPS (2 μg/ml), epiregulin (40 ng/ml), or amphiregulin (40 ng/ml) for 24 h. Data are shown as the mean percentage of absorbance and s.d. in comparison with untreated control cells from three independent experiments (*P<0.05). (c) LPS-induced cell proliferation is epiregulin and amphiregulin dependent. SW480 cells were pretreated with neutralizing anti-amphiregulin antibody, anti-epiregulin antibody, antibodies to both, or control immunoglobulin G for 2 h. Subsequently, cells were stimulated with LPS (2 μg/ml) for 24 h. Data are shown as the mean percentage of absorbance and s.d. in comparison with untreated control cells from three independent experiments (*P<0.05). (d) Epiregulin- and amphiregulin-induced cell proliferation show diverse kinetics. SW480 cells were stimulated with epiregulin (40 ng/ml) or amphiregulin (40 ng/ml) for 24, 48, or 72 h. Data are shown as the mean percentage of absorbance and s.d. in comparison with untreated control cells from three independent experiments (*P<0.05).
Figure 3
Figure 3
TLR4 differentially regulates epiregulin and amphiregulin expression in a murine acute colitis model. (a) Mucosal epiregulin expression is decreased in TLR4−/− mice at day 7 in the DSS model. Real-time PCR was used to compare mucosal expression of epiregulin mRNA in WT and TLR4−/− mice in the DSS model (n = 6 each). Data are represented as mean±s.d. of relative values of expression (*P<0.05). (b) Mucosal amphiregulin and epiregulin expression display different kinetics in WT mice over 4, 7, 11, 14, and 56 days of DSS treatment. Real-time PCR was used to compare mucosal expression of epiregulin and amphiregulin mRNA in WT and TLR4−/− mice in the DSS model (n = 6 each). Data are represented as mean±s.d. of relative values of expression (*P<0.05). (c) Representative immunofluorescent photographs of epiregulin and amphiregulin in colitic mucosa of day 7 and 14 of DSS colitis, respectively. The control slide stained only with secondary antibody. (d) IEC proliferation and histological changes of colonic mucosa during DSS colitis. IEC proliferation was assessed by counting the number of BrdU-positive cells per well-oriented crypt at high magnification under light microscopy. Data show average BrdU-positive cell number (±s.d.) in every three crypts for each colon segment. (e and f) Mucosal amphiregulin and epiregulin secretion display different kinetics in WT mice at day 7 vs day 56 of DSS treatment. The production of amphiregulin and epiregulin was measured in colonic mucosa from WT (n = 6) mice. Data are expressed as mean±s.d. (*P<0.05).
Figure 3
Figure 3
TLR4 differentially regulates epiregulin and amphiregulin expression in a murine acute colitis model. (a) Mucosal epiregulin expression is decreased in TLR4−/− mice at day 7 in the DSS model. Real-time PCR was used to compare mucosal expression of epiregulin mRNA in WT and TLR4−/− mice in the DSS model (n = 6 each). Data are represented as mean±s.d. of relative values of expression (*P<0.05). (b) Mucosal amphiregulin and epiregulin expression display different kinetics in WT mice over 4, 7, 11, 14, and 56 days of DSS treatment. Real-time PCR was used to compare mucosal expression of epiregulin and amphiregulin mRNA in WT and TLR4−/− mice in the DSS model (n = 6 each). Data are represented as mean±s.d. of relative values of expression (*P<0.05). (c) Representative immunofluorescent photographs of epiregulin and amphiregulin in colitic mucosa of day 7 and 14 of DSS colitis, respectively. The control slide stained only with secondary antibody. (d) IEC proliferation and histological changes of colonic mucosa during DSS colitis. IEC proliferation was assessed by counting the number of BrdU-positive cells per well-oriented crypt at high magnification under light microscopy. Data show average BrdU-positive cell number (±s.d.) in every three crypts for each colon segment. (e and f) Mucosal amphiregulin and epiregulin secretion display different kinetics in WT mice at day 7 vs day 56 of DSS treatment. The production of amphiregulin and epiregulin was measured in colonic mucosa from WT (n = 6) mice. Data are expressed as mean±s.d. (*P<0.05).

References

    1. Fukata M, Chen A, Vamadevan AS, et al. Toll-like receptor-4 promotes the development of colitis-associated colorectal tumors. Gastroenterology 2007;133:1869–1881. - PMC - PubMed
    1. Rakoff-Nahoum S, Paglino J, Eslami-Varzaneh F, et al. Recognition of commensal microflora by toll-like receptors is required for intestinal homeostasis. Cell 2004;118:229–241. - PubMed
    1. Abrams GD, Bauer H, Sprinz H. Influence of the normal flora on mucosal morphology and cellular renewal in the ileum. A comparison of germ-free and conventional mice. Lab Invest 1963;12:355–364. - PubMed
    1. Sartor RB. Clinical applications of advances in the genetics of IBD. Rev Gastroenterol Disord 2003;3(Suppl 1):S9–S17. - PubMed
    1. Kim SC, Tonkonogy SL, Albright CA, et al. Variable phenotypes of enterocolitis in interleukin 10-deficient mice monoassociated with two different commensal bacteria. Gastroenterology 2005;128: 891–906. - PubMed

Publication types

MeSH terms