. 2010 May 13;5(5):e10624.
doi: 10.1371/journal.pone.0010624.

Searching for signaling balance through the identification of genetic interactors of the Rab guanine-nucleotide dissociation inhibitor gdi-1

Affiliations

Searching for signaling balance through the identification of genetic interactors of the Rab guanine-nucleotide dissociation inhibitor gdi-1

Anna Y Lee et al. PLoS One. .

Abstract

Background: The symptoms of numerous diseases result from genetic mutations that disrupt the homeostasis maintained by the appropriate integration of signaling gene activities. The relationships between signaling genes suggest avenues through which homeostasis can be restored and disease symptoms subsequently reduced. Specifically, disease symptoms caused by loss-of-function mutations in a particular gene may be reduced by concomitant perturbations in genes with antagonistic activities.

Methodology/principal findings: Here we use network-neighborhood analyses to predict genetic interactions in Caenorhabditis elegans towards mapping antagonisms and synergisms between genes in an animal model. Most of the predicted interactions are novel, and the experimental validation establishes that our approach provides a gain in accuracy compared to previous efforts. In particular, we identified genetic interactors of gdi-1, the orthologue of GDI1, a gene associated with mental retardation in human. Interestingly, some gdi-1 interactors have human orthologues with known neurological functions, and upon validation of the interactions in mammalian systems, these orthologues would be potential therapeutic targets for GDI1-associated neurological disorders. We also observed the conservation of a gdi-1 interaction between different cellular systems in C. elegans, suggesting the involvement of GDI1 in human muscle degeneration.

Conclusions/significance: We developed a novel predictor of genetic interactions that may have the ability to significantly streamline the identification of therapeutic targets for monogenic disorders involving genes conserved between human and C. elegans.


Conflict of interest statement

Competing Interests: The authors have declared that no competing interests exist.

Figures

Figure 1
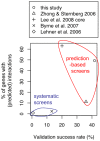
Figure 1. Comparison of large-scale genetic interaction studies in C. elegans.
The studies are compared in terms of the percentage of genes with identified/predicted interactions and the success rate of experimental validation (i.e. the fraction of tested gene pairs that exhibit a genetic interaction). Systematic experimental screens test a limited number of gene pairs due to the labor-intensive experimental procedures. Moreover, these screens identify a small number of interactions relative to the number of tested gene pairs since genetic interactions appear to be rare. Prediction-based methods can assess all pairs of genes in silico, and consequently, the percentage of genes with predicted interactions tends to be larger than the percentage of genes with interactions identified by a systematic experimental screen. Moreover, predictions focus experimental efforts on gene pairs that are likely to exhibit a genetic interaction. Accordingly, the success rates of prediction-driven screens tend to be greater than the rates for systematic experimental screens. The success rate of our study shown here is conservative since it was computed based on the following definition: a gene pair exhibits an interaction only if the interaction is statistically significant according to all considered epistasis models (see Methods).
Figure 2
Figure 2. Gene pair attributes used to predict genetic interactions.
The two genes/proteins of interest are highlighted with thick grey rings. (A) I, the presence or absence of a protein-protein (PP) interaction between the proteins encoded by the genes of interest, or their orthologues. (B) CI, a measure of the significance of the overlap between the PP interaction neighborhoods of the proteins encoded by the genes of interest (i.e. overlap of the red and blue regions). The PP interaction neighborhood of a given protein is the set of all of proteins that exhibit a PP interaction with the given protein (according to the multi-species PP interaction network). (C) N, an indicator for whether the neighborhoods of the genes of interest are enriched with the same phenotype. Here we define the neighborhood of a given gene as the set of genes that show significant coexpression (P≤0.05, see Methods) with the given gene and/or encode proteins that exhibit a PP interaction with the product of the given gene (according to the multi-species PP interaction network). Both neighborhoods shown here are enriched with a particular phenotype. (D) NPh, an indicator like N with the additional requirement that the genes of interest themselves must also exhibit the phenotype enriched in their neighborhoods.
Figure 3
Figure 3. Assessment of the biological relevance of the predicted genetic interaction network with pathway annotations.
Here we show scenarios where a pair of genes annotated to the same pathway (A) is directly connected or (B) shares ≥1 neighbor in a genetic interaction network, where the gene pair of interest is highlighted with thick grey rings. In (A), the genes exhibit a within-pathway genetic interaction based on the given set of pathway annotations. In (B), the genes belonging to the same pathway (e.g. pathway A) both interact with a gene that may either be an unknown member of the same pathway (within pathway interaction), or may belong to a different pathway (e.g. pathway B, between-pathway interactions). Below, the frequencies at which each scenario occurs in the predicted network and in randomized networks are shown with respect to all pathways and to signaling pathways only (see Methods). The “all pathways” and signaling pathway annotations were derived from human and C. elegans experimental data respectively. For each set of pathway annotations, the median, first and third quartile frequencies of each scenario were computed across N = 100K randomized networks; the bar length depicts the median and the error bars depict the first and third quartiles. Both scenarios occur more frequently than what is expected by chance, for both sets of pathway annotations.
Figure 4
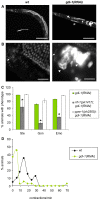
Figure 4. Phenotypical characterization of gdi-1(RNAi)-treated animals.
(A,B) DAPI staining of egfp(RNAi)- (labeled wt) and gdi-1(RNAi)-treated wild-type animals. (A) Gonad morphogenesis defects (Gon) characterized by short gonads (*) are observed in gdi-1(RNAi)-treated animals. Scale bar, 200 µm. (B) Accumulation of Endomitotic oocytes (Emo, arrowheads) in the proximal gonad of gdi-1(RNAi)-treated animals. Arrows indicate the spermathecae. Scale bar, 25 µm. (C) Sterility (Ste), Gon and Emo phenotypes were measured in wild-type, rrf-1(pk1417) and ppw-1(pk2505) animals submitted to gdi-1(RNAi) (N = 3). The mean expressivity/penetrance of each phenotype is shown with error bars representing ± one standard error. A (*) indicates a statistically significant reduction of the phenotypes (P≤0.05, Student's t-test) compared to wild-type animals treated with gdi-1(RNAi). (D) Distributions of the sheath cell contraction frequency for egfp(RNAi)- (labeled wt) and gdi-1(RNAi)-treated animals.
Figure 5
Figure 5. Validation of a subset of genetic interactions predicted for gdi-1.
Ste, Gon and Emo phenotypes were measured in animals submitted to RNAi against egfp (grey) or gdi-1 (green). The mean difference in the expressivity/penetrance of each phenotype in perturbed (mutant or chemically treated) versus wild-type (wt) animals (denoted φ[x]−φ[y], for animals of type x and y) is shown with error bars representing ± one standard error, N≥3. For Ste, the Z-score of the difference in expressivity is plotted (see Text S1). (Δ) and (*) indicate statistically significantly differences for animals treated with egfp(RNAi) and gdi-1(RNAi), respectively (P≤0.05, see Methods). NA: not available. (A) Differences in phenotype expressivity induced by mutations in genes predicted to interact with gdi-1. (B) Differences in phenotype expressivity induced by chemical treatment. Blebbistatin (Blebb.) is a myosin ATPase inhibitor and ML-7 is a specific inhibitor of myosin light-chain kinase.
Figure 6
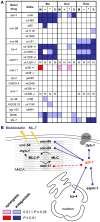
Figure 6. Epistasis between gdi-1 and its predicted genetic interactors and chemical suppressors.
(A) The minimum (M), additive (+) and multiplicative (*) statistical models of epistasis were used in the analysis. A statistical test for the specific suppression (S) of gdi-1(RNAi)-induced defects was also used (see Methods for details). Significant synergistic and antagonistic interactions are illustrated with shades of red and blue, respectively (P≤0.05). Darker shades indicate significant interactions with P≤0.01. The absence of a statistically significant interaction is indicated by a white entry. NA: not available. (B) Schematic representation of gdi-1 interactors. Blue lines represent antagonistic interactions with gdi-1. The dashed red line indicates phenocopy between mel-11 and gdi-1. unc-96 (paramyosin-binding protein), unc-89 [myosin light chain (MLC)-kinase], and mel-11 (MLC-phosphatase) are regulators of the actin-myosin contractile apparatus (AMCA, represented in grey) , . unc-54 and myo-1 are type II myosin heavy chains. tra-4 encodes a PLZF-like transcription factor . aspm-1 (orthologue of mammalian ASPM) and dyb-1 (orthologue of a component of the dystrophin glycoprotein complex, DGC) have been associated with mitotic spindle assembly and DGC function in human, respectively . ML-7 and blebbistatin (Blebb.) are specific inhibitors of MLC-kinase and myosin II ATPase activities, respectively.
Figure 7
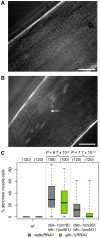
Figure 7. gdi-1 suppresses dys-1- and dyb-1-associated muscle degeneration.
Body-wall muscle fibers observed using polarized light microscopy in (A) wild-type and (B) dys-1(cx18);hlh-1(cc561) animals. The arrow indicates an abnormal/degenerated muscle cell. Scale bar, 200 µm. (C) Muscle degeneration was assessed in wild-type (wt), dys-1(cx18);hlh-1(cc561) and dyb-1(cx36);hlh-1(cc561) animals submitted to RNAi against egfp (grey) or gdi-1 (green). The percentage of abnormal muscle cells in a methanol fixed animal, estimated with polarized light microscopy, was used to quantify muscle degeneration in the animal. Boxplots of these percentages are shown. The total number of animals assessed across three independent experiments is shown above each boxplot in parentheses. The percentage of abnormal muscle cells is significantly reduced in gdi-1(RNAi)-treated versus egfp(RNAi)-treated mutant animals as indicated by the P values shown at the top (see Methods).

Similar articles

Cited by

References

    1. Schubert V, Dotti CG. Transmitting on actin: synaptic control of dendritic architecture. J Cell Sci. 2007;120:205–212. - PubMed
    1. Newey SE, Velamoor V, Govek EE, Van Aelst L. Rho GTPases, dendritic structure, and mental retardation. J Neurobiol. 2005;64:58–74. - PubMed
    1. Kutsche K, Yntema H, Brandt A, Jantke I, Nothwang HG, et al. Mutations in ARHGEF6, encoding a guanine nucleotide exchange factor for Rho GTPases, in patients with X-linked mental retardation. Nat Genet. 2000;26:247–250. - PubMed
    1. Tavazoie SF, Alvarez VA, Ridenour DA, Kwiatkowski DJ, Sabatini BL. Regulation of neuronal morphology and function by the tumor suppressors Tsc1 and Tsc2. Nat Neurosci. 2005;8:1727–1734. - PubMed
    1. D'Adamo P, Menegon A, Lo Nigro C, Grasso M, Gulisano M, et al. Mutations in GDI1 are responsible for X-linked non-specific mental retardation. Nat Genet. 1998;19:134–139. - PubMed

Publication types

MeSH terms

Substances