. 2010 May 13;5(5):e10636.
doi: 10.1371/journal.pone.0010636.

Human Th1 cells that express CD300a are polyfunctional and after stimulation up-regulate the T-box transcription factor eomesodermin

Affiliations

Human Th1 cells that express CD300a are polyfunctional and after stimulation up-regulate the T-box transcription factor eomesodermin

Sriram Narayanan et al. PLoS One. .

Abstract

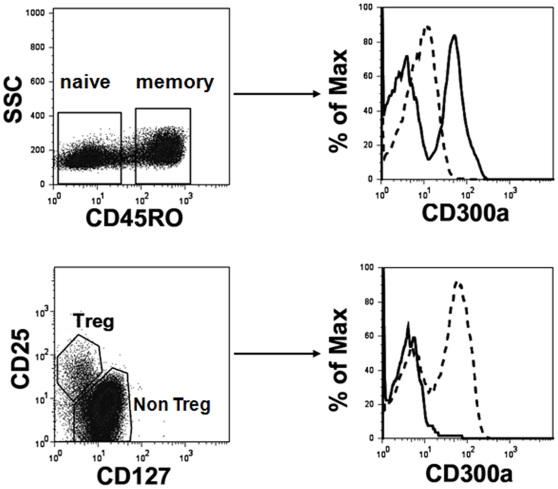
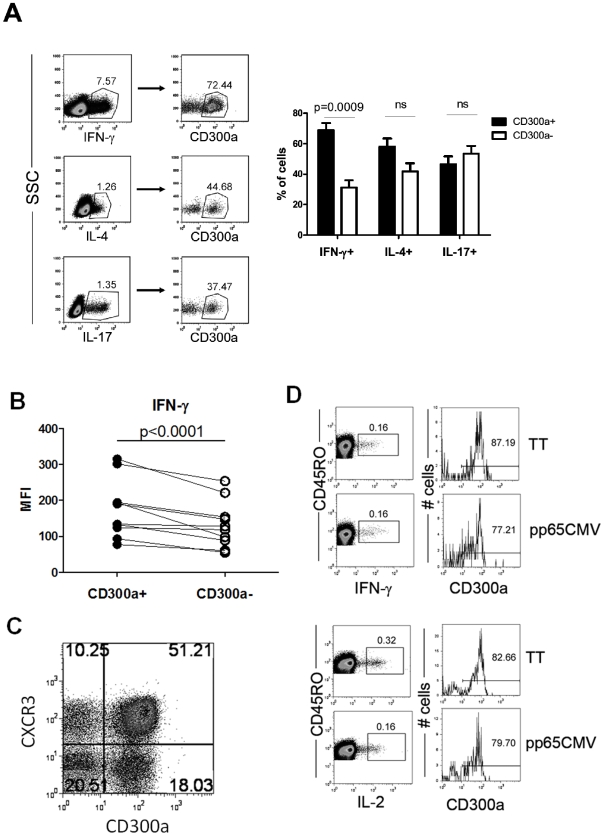
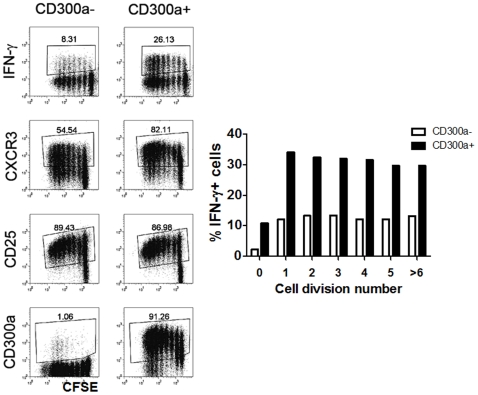
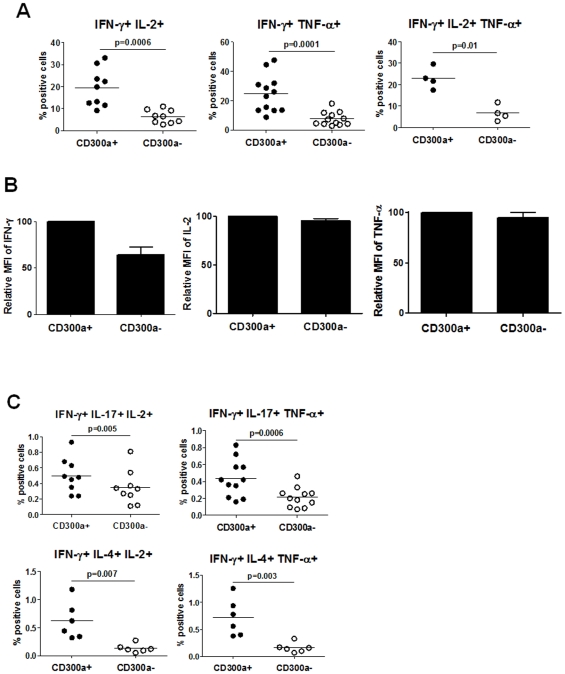
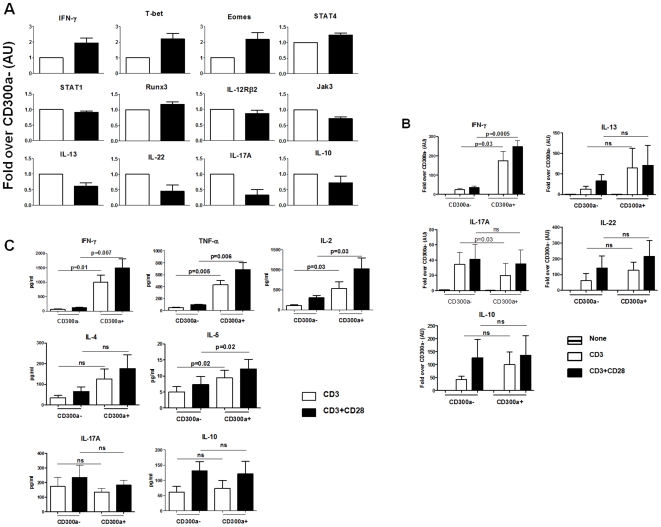
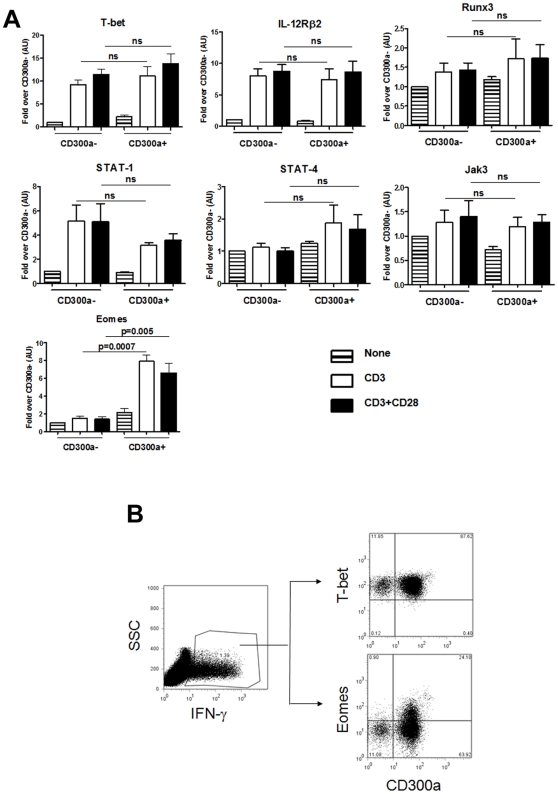
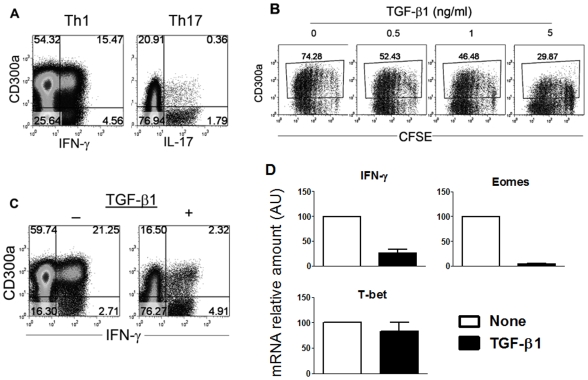
Human naïve CD4 T cells express low levels of the immunomodulatory receptor CD300a, whereas effector/memory CD4 cells can be either CD300a(+) or CD300a(-). This suggested that CD300a expression could define a specific subset within the effector/memory CD4 T cell subpopulations. In fact, ex vivo analysis of the IFN-gamma producing CD4 T cells showed that they are enriched in the CD300a(+) subset. Moreover, stimulated CD4 T cells producing TNF-alpha and IL-2 besides IFN-gamma (polyfunctional) are predominantly CD300a(+). In addition to producing markedly higher levels of Th1-associated cytokines, the stimulated CD300a(+) CD4 T cells are distinguished by a striking up-regulation of the T-box transcription factor eomesodermin (Eomes), whereas T-bet is up-regulated in both CD300a(+) and CD300a(-) activated CD4 T cells to similar levels. The pleiotropic cytokine TGF-beta1 has a determinant role in dictating the development of this Th1 subset, as its presence inhibits the expression of CD300a and down-regulates the expression of Eomes and IFN-gamma. We conclude that CD300a(+) human Th1 cells tend to be polyfunctional and after stimulation up-regulate Eomes.


Conflict of interest statement

Competing Interests: The authors have declared that no competing interests exist.

Figures

Figure 1
Figure 1. Flow cytometric analysis of human peripheral blood CD4 T cells.
In the upper panel, freshly isolated CD4 T cells were labeled with anti-CD4, -CD45RO, and -CD300a mAb. The lymphocyte gate was determined according to the forward and side scatter parameters. Then CD45RO expression was determined for the CD4+ cells. The expression of CD300a was assessed in naïve cells (CD45RO, dashed line) and memory cells (CD45RO+, continuous line). In the lower panel, freshly isolated CD4 T cells were labeled with anti-CD4, -CD25, -CD127 and -CD300a mAb. After electronically gating the CD4+ cells, the expression of CD300a was assessed for the Treg cells (CD25+CD127low, continuous line) and non Treg cells (dashed line). Results are representative of 12 healthy donors.
Figure 2
Figure 2. Human circulating IFN-γ producing CD4 T cells are enriched in the CD300a+ subset.
(A) Flow cytometric analyses for the production of IFN-γ, IL-4 and IL-17 in combination with cell surface expression of CD300a by purified CD4 T cells stimulated with PMA and ionomycin for 4–5 h. The lymphocyte gate was determined according to the forward and side scatter parameters. The CD300a expression was determined for the cytokine producing cells. A representative healthy donor is shown. The bar graph represents the average ± SEM of the percentage of CD300a+ cells within each cytokine producing subset. Results are from 15–19 donors. (B) MFI of IFN-γ expression in the cytokine producing memory CD300a+ and CD300a cells. (C) Expression of CXCR3 and CD300a by circulating memory CD4 T cells. Freshly isolated CD4 T cells were labeled with anti-CD4,-CD45RO, -CD300a and -CXCR3. Dot plots are from CD4+CD45RO+ gated cells. Results from a representative donor are shown from four donors that were analyzed. (D) PBMCs from healthy donors were stimulated overnight with CMV pp65 or TT in the presence of brefeldin A and then analyzed for the production of IFN-γ and IL-2 by memory CD4 T cells (CD4+CD45RO+). For the cytokine positive cells, the cell surface expression of CD300a was measured. The response of two of the four donors analyzed is shown.
Figure 3
Figure 3. Proliferation and phenotype of CD45RO+CD300a+ and CD45RO+CD300a CD4 T cells.
Proliferation, as measured by CFSE dilution, of sorted CD45RO+CD300a+ and CD45RO+CD300a cells in response to plate bound anti-CD3 plus anti-CD28 mAb. After three days of stimulation, cells were rested four additional days. After the resting period, the cell surface expression of CXCR3, CD25 and CD300a was measured. IFN-γ production was measured by intracellular staining after a brief stimulation with PMA and ionomycin for 4 h. The bar graph represents the percentage of IFN-γ+ cells for each cell generation in the CD300a+ and CD300a subsets. Results shown are representative of four different donors.
Figure 4
Figure 4. CD300a+ CD4 T cells are more polyfunctional than CD300a CD4 T cells.
(A) Purified CD4 T cells were stimulated with PMA and ionomycin for 4–5 h. Then, cells were stained for cell surface expression of CD300a and production of IFN-γ and TNF-α and/or IL-2. The percentage of double and triple producers in the CD300a+ and CD300a cells is shown. Each symbol represents a different donor. (B) Graphic representation of the average ± SEM of the MFI of IFN-γ, IL-2 or TNF-α for the triple producers shown in panel A. (C) Purified CD4 T cells were stimulated with PMA and ionomycin for 4–5 h. Then, cells were stained for cell surface expression of CD300a and the production of the indicated cytokines. The percentage of triple cytokine producers in the CD300a+ and CD300a subsets is shown. Each symbol is a different donor.
Figure 5
Figure 5. The cytokine and transcription factor signature of CD300a+ and CD300a human memory CD4 T cells.
(A) Purified CD4 T cells were sorted into CD45RO+CD300a+ (black bars) and CD45RO+CD300a (white bars). RNA was extracted and the levels of mRNAs were determined by real-time PCR. Graphs represent the average ± SEM. AU: arbitrary units. Data are from 5–6 donors. These data correspond to the untreated (none) samples in Figures 5B and 6A. (B) Purified CD4 T cells were sorted into CD45RO+CD300a+ and CD45RO+CD300a and then stimulated overnight with plate bound anti-CD3 or anti-CD3 plus anti-CD28 mAb. RNA was extracted from cells and specific cytokine mRNAs were quantified by real-time PCR. (C) Supernatants from the cultures were harvested and the levels of cytokines were measured.
Figure 6
Figure 6. CD300a+ cells up-regulate Eomes after stimulation.
(A) mRNAs for the indicated transcription factors, and IL-12Rβ2 and Jak3 were quantified by real-time PCR. Graph represents the average ± SEM. AU: arbitrary units. Data are from 5–6 donors. (B) Purified CD4 T cells were stimulated with plate bound anti-CD3 plus anti-CD28 mAb for 24 h. The lymphocyte gate was determined according to the forward and side scatter parameters. Then cells were stained for cell surface expression of CD300a and for the intracellular expression of IFN-γ. The expression of Eomes, T-bet and CD300a was determined in the IFN-γ+ cells. Results are representative of three donors.
Figure 7
Figure 7. TGF-β1 down-regulates the expression of CD300a and Eomes in Th1 cells.
(A) Sorted naïve CD4 T cells were polarized under Th1 or Th17 conditions as described in materials and methods. At day 12, cells were stimulated with PMA and ionomycin for 4 h, after which the cell surface expression of CD300a and the production of IFN-γ or IL-17 was determined. Results from a representative donor are shown from four donors that were analyzed. (B) Proliferation, as measured by CFSE dilution, of purified CD4 cells in response to plate bound anti-CD3 plus anti-CD28 mAb in the absence or presence of increasing amounts of TGF-β1. After three days of stimulation cells were rested four additional days. After the resting period, the cell surface expression of CD300a was measured. Results from a representative donor are shown from three donors that were analyzed. (C) Sorted naïve CD4 T cells were polarized under Th1 conditions in the absence or presence of 5 ng/ml of TGF-β1. At day 12, cells were stimulated with PMA and ionomycin for 4 h and the cell surface expression of CD300a and production of IFN-γ were determined. Results from a representative donor are shown from four donors that were analyzed. (D) Sorted naïve CD4 T cells were polarized under Th1 conditions in the absence or presence of 5 ng/ml of TGF-β1. At day 12, cells were stimulated with plate bound anti-CD3 + anti-CD28 mAb overnight, followed by RNA extraction. Specific mRNAs for IFN-γ, T-bet and Eomes were quantified by real-time PCR. Bar graphs show the averages of the percentage decrease in the presence of TGF-β1 ± SEM. Data are from 4 donors.

Similar articles

Cited by

References

    1. Zhu J, Paul WE. CD4 T cells: fates, functions, and faults. Blood. 2008;112:1557–1569. - PMC - PubMed
    1. Foulds KE, Wu CY, Seder RA. Th1 memory: implications for vaccine development. Immunol Rev. 2006;211:58–66. - PubMed
    1. Luger D, Silver PB, Tang J, Cua D, Chen Z, et al. Either a Th17 or a Th1 effector response can drive autoimmunity: conditions of disease induction affect dominant effector category. J Exp Med. 2008;205:799–810. - PMC - PubMed
    1. Tang J, Zhu W, Silver PB, Su SB, Chan CC, et al. Autoimmune uveitis elicited with antigen-pulsed dendritic cells has a distinct clinical signature and is driven by unique effector mechanisms: initial encounter with autoantigen defines disease phenotype. J Immunol. 2007;178:5578–5587. - PubMed
    1. Georas SN, Guo J, De Fanis U, Casolaro V. T-helper cell type-2 regulation in allergic disease. Eur Respir J. 2005;26:1119–1137. - PubMed

Publication types

MeSH terms