

In vivo, multimodal imaging of B cell distribution and response to antibody immunotherapy in mice
- PMID: 20498725
- PMCID: PMC2871797
- DOI: 10.1371/journal.pone.0010655
In vivo, multimodal imaging of B cell distribution and response to antibody immunotherapy in mice
Abstract
Background: B cell depletion immunotherapy has been successfully employed to treat non-Hodgkin's lymphoma. In recent years, increasing attention has been directed towards also using B-cell depletion therapy as a treatment option in autoimmune disorders. However, it appears that the further development of these approaches will depend on a methodology to determine the relation of B-cell depletion to clinical response and how individual patients should be dosed. Thus far, patients have generally been followed by quantification of peripheral blood B cells, but it is not apparent that this measurement accurately reflects systemic B cell dynamics.
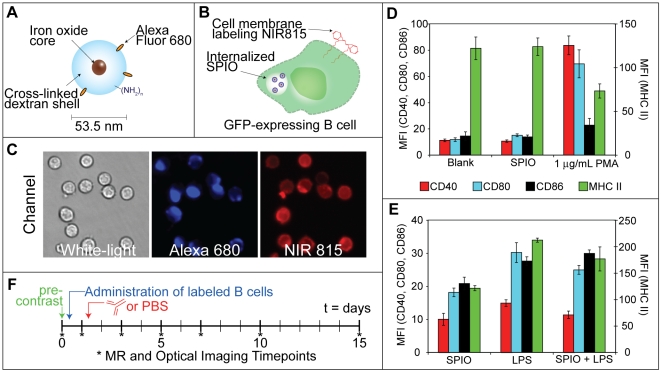
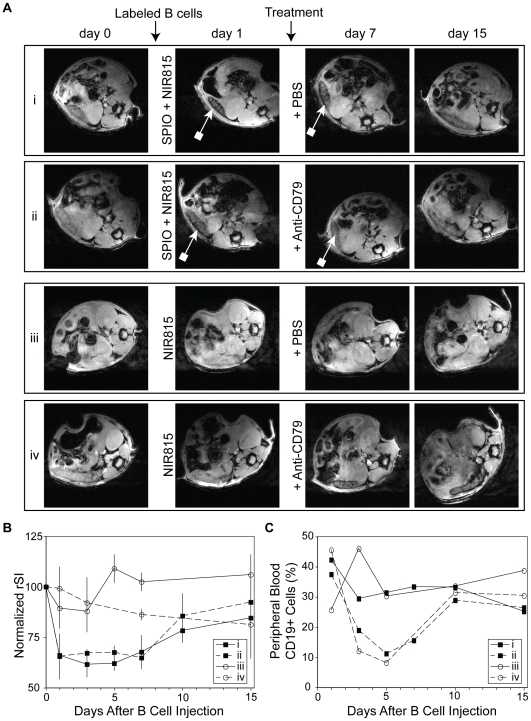
Methodology/principal findings: Cellular imaging of the targeted population in vivo may provide significant insight towards effective therapy and a greater understanding of underlying disease mechanics. Superparamagnetic iron oxide (SPIO) nanoparticles in concert with near infrared (NIR) fluorescent dyes were used to label and track primary C57BL/6 B cells. Following antibody mediated B cell depletion (anti-CD79), NIR-only labeled cells were expeditiously cleared from the circulation and spleen. Interestingly, B cells labeled with both SPIO and NIR were not depleted in the spleen.
Conclusions/significance: Whole body fluorescent tracking of B cells enabled noninvasive, longitudinal imaging of both the distribution and subsequent depletion of B lymphocytes in the spleen. Quantification of depletion revealed a greater than 40% decrease in splenic fluorescent signal-to-background ratio in antibody treated versus control mice. These data suggest that in vivo imaging can be used to follow B cell dynamics, but that the labeling method will need to be carefully chosen. SPIO labeling for tracking purposes, generally thought to be benign, appears to interfere with B cell functions and requires further examination.
Conflict of interest statement
Figures


Similar articles
-
Effects of specific anti-B and/or anti-plasma cell immunotherapy on antibody production in baboons: depletion of CD20- and CD22-positive B cells does not result in significantly decreased production of anti-alphaGal antibody.Xenotransplantation. 2001 Aug;8(3):157-71. doi: 10.1034/j.1399-3089.2001.008003157.x. Xenotransplantation. 2001. PMID: 11472623
-
[Molecular mechanisms of B lymphocyte depletion by CD20 immunotherapy].Nihon Rinsho Meneki Gakkai Kaishi. 2009 Feb;32(1):29-34. doi: 10.2177/jsci.32.29. Nihon Rinsho Meneki Gakkai Kaishi. 2009. PMID: 19252375 Review. Japanese.
-
In vivo effects of targeting CD79b with antibodies and antibody-drug conjugates.Mol Cancer Ther. 2009 Oct;8(10):2937-46. doi: 10.1158/1535-7163.MCT-09-0369. Epub 2009 Oct 6. Mol Cancer Ther. 2009. PMID: 19808977
-
Magnetic resonance and near-infrared imaging using a novel dual-modality nano-probe for dendritic cell tracking in vivo.Cytotherapy. 2014 May;16(5):699-710. doi: 10.1016/j.jcyt.2013.09.006. Epub 2013 Nov 9. Cytotherapy. 2014. PMID: 24219906
-
CD19: a promising B cell target for rheumatoid arthritis.Nat Rev Rheumatol. 2009 Oct;5(10):572-7. doi: 10.1038/nrrheum.2009.184. Nat Rev Rheumatol. 2009. PMID: 19798033 Review.
Cited by
-
Dawn of advanced molecular medicine: nanotechnological advancements in cancer imaging and therapy.Crit Rev Oncog. 2014;19(3-4):143-76. doi: 10.1615/critrevoncog.2014011601. Crit Rev Oncog. 2014. PMID: 25271430 Free PMC article. Review.
-
The Immunoimaging Toolbox.J Nucl Med. 2018 Aug;59(8):1174-1182. doi: 10.2967/jnumed.116.185967. Epub 2018 May 24. J Nucl Med. 2018. PMID: 29794226 Free PMC article. Review.
-
Molecular imaging of bacterial infections in vivo: the discrimination of infection from inflammation.Informatics (MDPI). 2014 May 30;1(1):72-99. doi: 10.3390/informatics1010072. Informatics (MDPI). 2014. PMID: 26985401 Free PMC article.
-
Advances in Molecular Imaging Strategies for In Vivo Tracking of Immune Cells.Biomed Res Int. 2016;2016:1946585. doi: 10.1155/2016/1946585. Epub 2016 Sep 20. Biomed Res Int. 2016. PMID: 27725934 Free PMC article. Review.
-
Nanotheranostic Strategies for Cancer Immunotherapy.Small Methods. 2022 Dec;6(12):e2200718. doi: 10.1002/smtd.202200718. Epub 2022 Nov 16. Small Methods. 2022. PMID: 36382571 Free PMC article. Review.
References
-
- Grillo-Lopez AJ, White CA, Dallaire BK, Varns CL, Shen CD, et al. Rituximab: the first monoclonal antibody approved for the treatment of lymphoma. Curr Pharm Biotechnol. 2000;1:1–9. - PubMed
-
- Reff ME, Carner K, Chambers KS, Chinn PC, Leonard JE, et al. Depletion of B cells in vivo by a chimeric mouse human monoclonal antibody to CD20. Blood. 1994;83:435–445. - PubMed
-
- Levine TD, Pestronk A. IgM antibody-related polyneuropathies: B-cell depletion chemotherapy using Rituximab. Neurology. 1999;52:1701–1704. - PubMed
-
- Renaud S, Gregor M, Fuhr P, Lorenz D, Deuschl G, et al. Rituximab in the treatment of polyneuropathy associated with anti-MAG antibodies. Muscle Nerve. 2003;27:611–615. - PubMed
Publication types
MeSH terms
Substances
LinkOut - more resources
Full Text Sources
Miscellaneous
