

Taxonomic distinctness of demersal fishes of the California current: moving beyond simple measures of diversity for marine ecosystem-based management
- PMID: 20498727
- PMCID: PMC2871800
- DOI: 10.1371/journal.pone.0010653
Taxonomic distinctness of demersal fishes of the California current: moving beyond simple measures of diversity for marine ecosystem-based management
Abstract
Background: Large-scale patterns or trends in species diversity have long interested ecologists. The classic pattern is for diversity (e.g., species richness) to decrease with increasing latitude. Taxonomic distinctness is a diversity measure based on the relatedness of the species within a sample. Here we examined patterns of taxonomic distinctness in relation to latitude (ca. 32-48 degrees N) and depth (ca. 50-1220 m) for demersal fishes on the continental shelf and slope of the US Pacific coast.
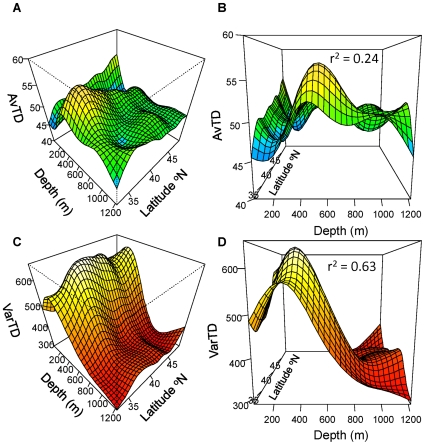
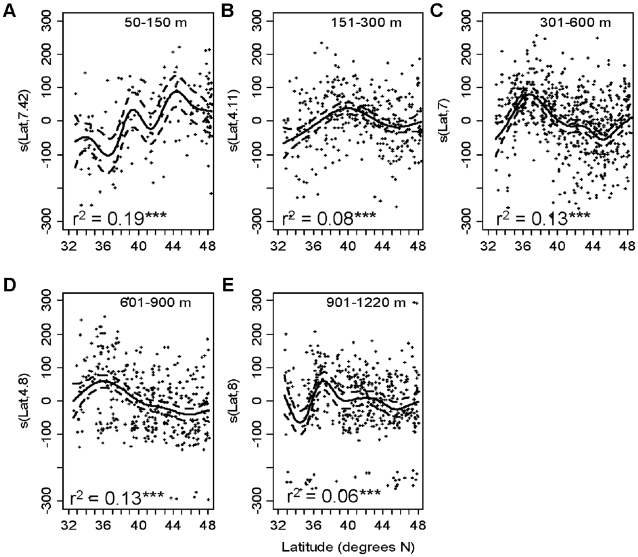
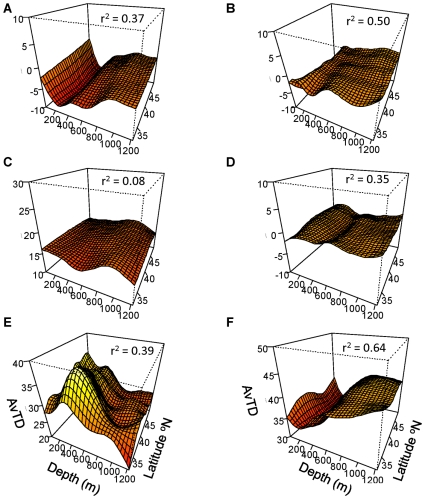
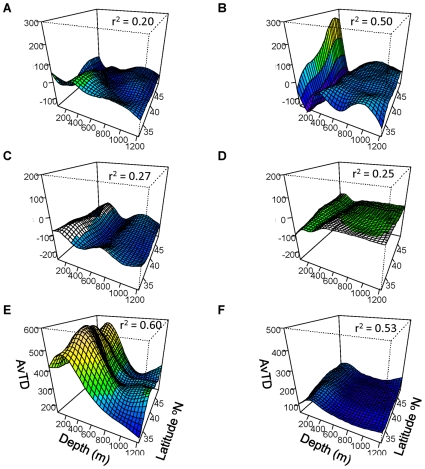
Methodology/principal findings: Both average taxonomic distinctness (AvTD) and variation in taxonomic distinctness (VarTD) changed with latitude and depth. AvTD was highest at approximately 500 m and lowest at around 200 m bottom depth. Latitudinal trends in AvTD were somewhat weaker and were depth-specific. AvTD increased with latitude on the shelf (50-150 m) but tended to decrease with latitude at deeper depths. Variation in taxonomic distinctness (VarTD) was highest around 300 m. As with AvTD, latitudinal trends in VarTD were depth-specific. On the shelf (50-150 m), VarTD increased with latitude, while in deeper areas the patterns were more complex. Closer inspection of the data showed that the number and distribution of species within the class Chondrichthyes were the primary drivers of the overall patterns seen in AvTD and VarTD, while the relatedness and distribution of species in the order Scorpaeniformes appeared to cause the relatively low observed values of AvTD at around 200 m.
Conclusions/significance: These trends contrast to some extent the patterns seen in earlier studies for species richness and evenness in demersal fishes along this coast and add to our understanding of diversity of the demersal fishes of the California Current.
Conflict of interest statement
Figures


Similar articles
-
Beta diversity of demersal fish assemblages in the North-Eastern Pacific: interactions of latitude and depth.PLoS One. 2013;8(3):e57918. doi: 10.1371/journal.pone.0057918. Epub 2013 Mar 19. PLoS One. 2013. PMID: 23526960 Free PMC article.
-
Patterns and Variation in Benthic Biodiversity in a Large Marine Ecosystem.PLoS One. 2015 Aug 26;10(8):e0135135. doi: 10.1371/journal.pone.0135135. eCollection 2015. PLoS One. 2015. PMID: 26308521 Free PMC article.
-
Diversity and composition of demersal fishes along a depth gradient assessed by baited remote underwater stereo-video.PLoS One. 2012;7(10):e48522. doi: 10.1371/journal.pone.0048522. Epub 2012 Oct 31. PLoS One. 2012. PMID: 23119045 Free PMC article.
-
Explaining bathymetric diversity patterns in marine benthic invertebrates and demersal fishes: physiological contributions to adaptation of life at depth.Biol Rev Camb Philos Soc. 2014 May;89(2):406-26. doi: 10.1111/brv.12061. Epub 2013 Oct 4. Biol Rev Camb Philos Soc. 2014. PMID: 24118851 Free PMC article. Review.
-
Does fish larval dispersal differ between high and low latitudes?Proc Biol Sci. 2013 Mar 20;280(1759):20130327. doi: 10.1098/rspb.2013.0327. Print 2013 May 22. Proc Biol Sci. 2013. PMID: 23516247 Free PMC article. Review.
Cited by
-
Spatio-temporal patterns in juvenile habitat for 13 groundfishes in the California Current Ecosystem.PLoS One. 2020 Aug 21;15(8):e0237996. doi: 10.1371/journal.pone.0237996. eCollection 2020. PLoS One. 2020. PMID: 32822408 Free PMC article.
-
Evolutionary drivers of the hump-shaped latitudinal gradient of benthic polychaete species richness along the Southeastern Pacific coast.PeerJ. 2021 Sep 27;9:e12010. doi: 10.7717/peerj.12010. eCollection 2021. PeerJ. 2021. PMID: 34692242 Free PMC article.
-
Assessment of ectomycorrhizal biodiversity in Tuber macrosporum productive sites.Mycorrhiza. 2014 May;24(4):281-92. doi: 10.1007/s00572-013-0538-3. Mycorrhiza. 2014. PMID: 24232503
-
Mesostigmata diversity by manure type: a reference study and new datasets from southwestern Iran.Exp Appl Acarol. 2022 Apr;86(4):517-534. doi: 10.1007/s10493-022-00710-1. Epub 2022 Mar 31. Exp Appl Acarol. 2022. PMID: 35357605 Free PMC article.
-
Taxonomic distinctness and richness of helminth parasite assemblages of freshwater fishes in Mexican hydrological basins.PLoS One. 2013 Sep 27;8(9):e74419. doi: 10.1371/journal.pone.0074419. eCollection 2013. PLoS One. 2013. PMID: 24086342 Free PMC article.
References
-
- Gotelli NJ, Anderson MJ, Arita HT, Chao A, Colwell RK, et al. Patterns and causes of species richness: a general simulation model for macroecology. Ecology Letters. 2009;12:873–886. - PubMed
-
- Willig MR, Kaufam DM, Stevens RD. Latitudinal gradients of biodiversity: pattern, process, scale, and synthesis. Annual Review of Ecology and Systematics. 2003;34:273–309.
-
- Chown SL, Gaston KJ. Areas, cradles and museums: the latitudinal gradient in species richness. Trends in Ecology and Evolution. 2000;15:311–315. - PubMed
-
- Hooper DU, Chapin FS, III, Ewel JJ, Hector A, Inchausti P, et al. Effects of biodiversity on ecosystem functioning: a consensus of current knowledge. Ecological Monographs. 2005;75:3–35.
Publication types
MeSH terms
LinkOut - more resources
Full Text Sources
Research Materials
