

Multi-wavelength Spatial LED illumination based detector for in vitro detection of Botulinum Neurotoxin A Activity
- PMID: 20498728
- PMCID: PMC2874159
- DOI: 10.1016/j.snb.2010.02.009
Multi-wavelength Spatial LED illumination based detector for in vitro detection of Botulinum Neurotoxin A Activity
Abstract
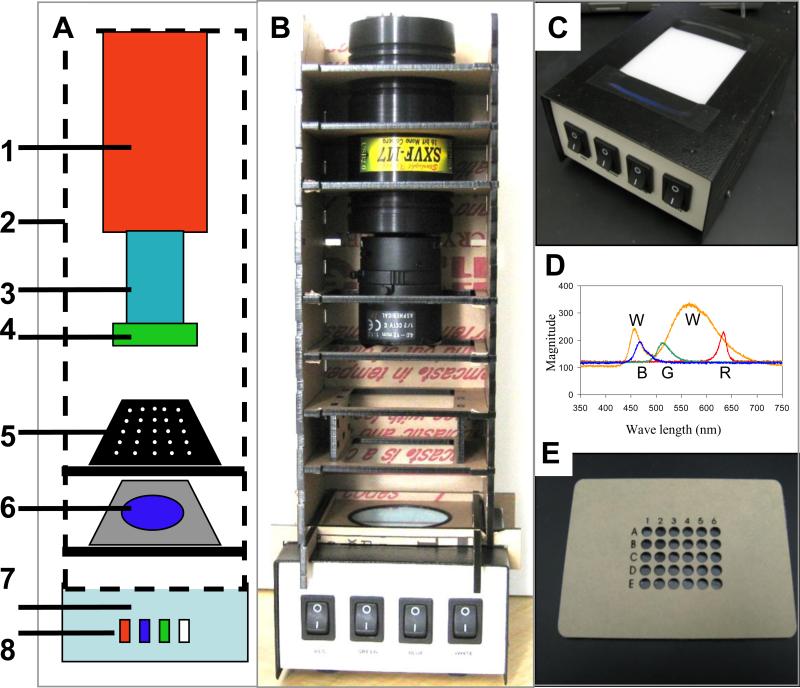
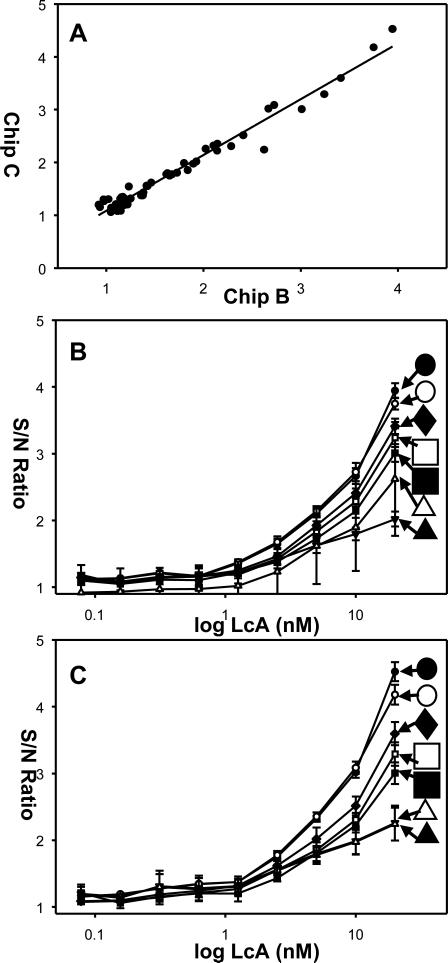
A portable and rapid detection system for the activity analysis of Botulinum Neurotoxins (BoNT) is needed for food safety and bio-security applications. To improve BoNT activity detection, a previously designed portable charge-coupled device (CCD) based detector was modified and equipped with a higher intensity more versatile multi-wavelength spatial light-emitting diode (LED) illumination, a faster CCD detector and the capability to simultaneously detect 30 samples. A FITC/DABCYL Förster Resonance Energy Transfer (FRET)-labeled peptide substrate (SNAP-25), with BoNT-A target cleavage site sequence was used to measure BoNT-A light chain (LcA) activity through the FITC fluorescence increase that occurs upon peptide substrate cleavage. For fluorescence excitation, a multi-wavelength spatial LED illuminator was used and compared to our previous electroluminescent (EL) strips. The LED illuminator was equipped with blue, green, red and white LEDs, covering a spectrum of 450-680 nm (red 610-650 nm, green 492-550 nm, blue 450-495 nm, and white LED 440-680 nm). In terms of light intensity, the blue LED was found to be ~80 fold higher than the previously used blue EL strips. When measuring the activity of LcA the CCD detector limit of detection (LOD) was found to be 0.08 nM LcA for both the blue LED (2 s exposure) and the blue EL (which require ≥60 s exposure) while the limits of quantitation (LOQ) is about 1 nM. The LOD for white LED was higher at 1.4 nM while the white EL was not used for the assay due to a high variable background. Unlike the weaker intensity EL illumination the high intensity LED illumination enabled shorter exposure times and allowed multi-wavelength illumination without the need to physically change the excitation strip, thus making spectrum excitation of multiple fluorophores possible increasing the versatility of the detector platform for a variety of optical detection assays.
Figures
Similar articles
-
A fluorescence detection platform using spatial electroluminescent excitation for measuring botulinum neurotoxin A activity.Biosens Bioelectron. 2008 Dec 1;24(4):618-25. doi: 10.1016/j.bios.2008.06.018. Epub 2008 Jun 18. Biosens Bioelectron. 2008. PMID: 18644709 Free PMC article.
-
Lab-on-a-chip for botulinum neurotoxin a (BoNT-A) activity analysis.Lab Chip. 2009 Nov 21;9(22):3275-81. doi: 10.1039/b912097a. Epub 2009 Sep 17. Lab Chip. 2009. PMID: 19865736 Free PMC article.
-
Charged-coupled device (CCD) detectors for Lab-on-a Chip (LOC) optical analysis.Methods Mol Biol. 2013;949:365-85. doi: 10.1007/978-1-62703-134-9_23. Methods Mol Biol. 2013. PMID: 23329454
-
The possible ocular hazards of LED dental illumination applications.J Tenn Dent Assoc. 2013 Fall-Winter;93(2):25-9; quiz 30-1. J Tenn Dent Assoc. 2013. PMID: 24611218 Review.
-
In Vivo Observations of Rapid Scattered Light Changes Associated with Neurophysiological Activity.In: Frostig RD, editor. In Vivo Optical Imaging of Brain Function. 2nd edition. Boca Raton (FL): CRC Press/Taylor & Francis; 2009. Chapter 5. In: Frostig RD, editor. In Vivo Optical Imaging of Brain Function. 2nd edition. Boca Raton (FL): CRC Press/Taylor & Francis; 2009. Chapter 5. PMID: 26844322 Free Books & Documents. Review.
Cited by
-
Orthographic projection capillary array fluorescent sensor for mHealth.Methods. 2013 Oct;63(3):276-81. doi: 10.1016/j.ymeth.2013.07.044. Epub 2013 Sep 7. Methods. 2013. PMID: 24018203 Free PMC article.
-
Capillary Array Waveguide Amplified Fluorescence Detector for mHealth.Sens Actuators B Chem. 2013 Sep;186:711-717. doi: 10.1016/j.snb.2013.06.030. Sens Actuators B Chem. 2013. PMID: 24039345 Free PMC article.
-
Improving the Sensitivity and Functionality of Mobile Webcam-Based Fluorescence Detectors for Point-of-Care Diagnostics in Global Health.Diagnostics (Basel). 2016 May 17;6(2):19. doi: 10.3390/diagnostics6020019. Diagnostics (Basel). 2016. PMID: 27196933 Free PMC article. Review.
-
Thousand-fold fluorescent signal amplification for mHealth diagnostics.Biosens Bioelectron. 2014 Jan 15;51:1-7. doi: 10.1016/j.bios.2013.06.053. Epub 2013 Jul 17. Biosens Bioelectron. 2014. PMID: 23928092 Free PMC article.
-
Evaluation of the uniformity of UVA LED illumination on flat surfaces: Discrete ordinate method, single axis, and surface scanning radiometry.Heliyon. 2023 May 20;9(6):e16557. doi: 10.1016/j.heliyon.2023.e16557. eCollection 2023 Jun. Heliyon. 2023. PMID: 37251462 Free PMC article.
References
-
- Peruski AH, Johnson LH, 3rd, Peruski LF., Jr. Rapid and sensitive detection of biological warfare agents using time-resolved fluorescence assays. J Immunol Methods. 2002;263:35–41. - PubMed
-
- Keller JE, Nowakowski JL, Filbert MG, Adler M. Rapid microplate assay for monitoring botulinum neurotoxin B catalytic activity. J Appl Toxicol. 1999;19(Suppl 1):S13–7. - PubMed
-
- Han SM, Cho JH, Cho IH, et al. Plastic enzyme-linked immunosorbent assays (ELISA)-on-a-chip biosensor for botulinum neurotoxin A. Anal Chim Acta. 2007;587:1–8. - PubMed
-
- Guglielmo-Viret V, Attree O, Blanco-Gros V, Thullier P. Comparison of electrochemiluminescence assay and ELISA for the detection of Clostridium botulinum type B neurotoxin. Journal of immunological methods. 2005;301:164–72. - PubMed
Grants and funding
LinkOut - more resources
Full Text Sources
Other Literature Sources
Molecular Biology Databases
Research Materials