

Characterization of tumor progression in engineered tissue using infrared spectroscopic imaging
- PMID: 20498913
- PMCID: PMC3030988
- DOI: 10.1039/c0an00112k
Characterization of tumor progression in engineered tissue using infrared spectroscopic imaging
Abstract
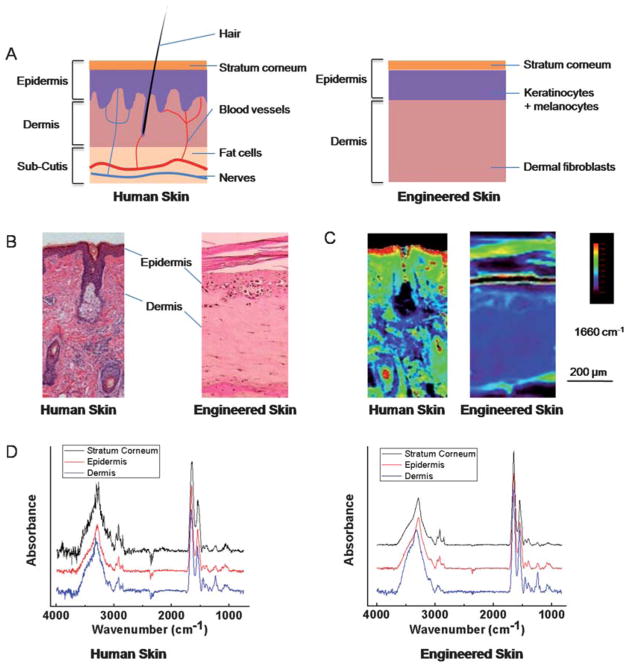
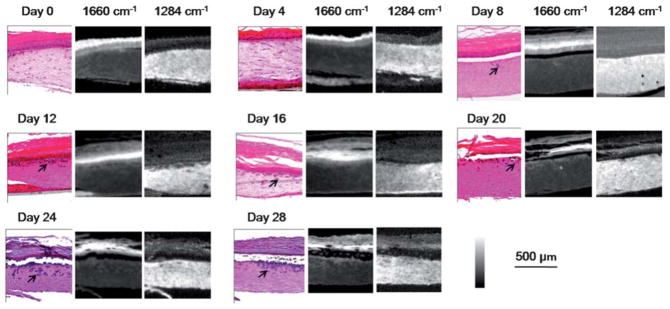
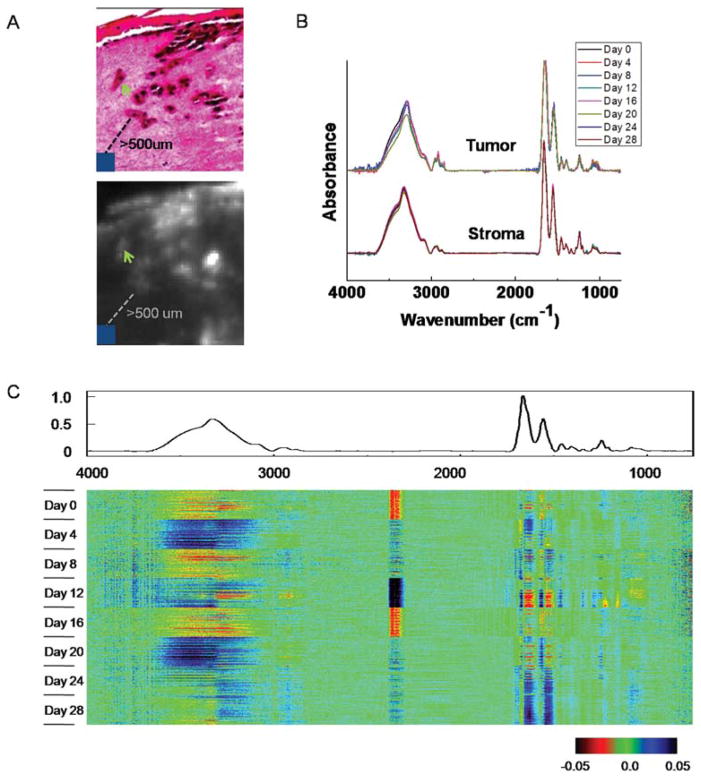
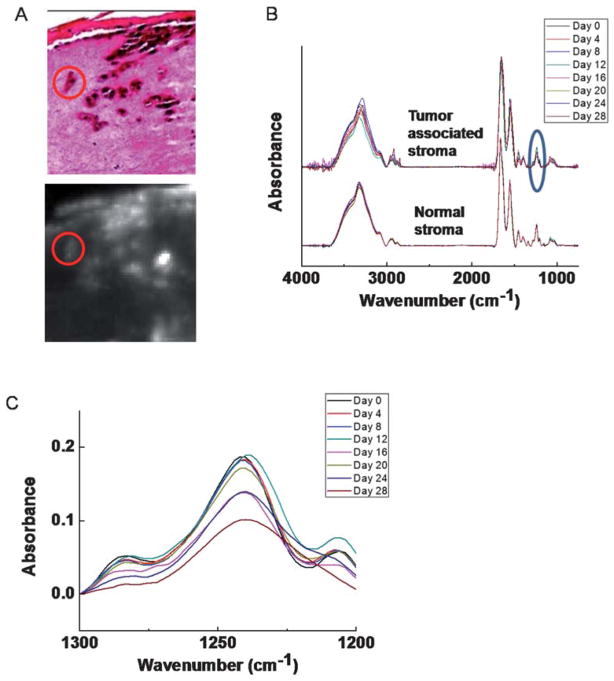
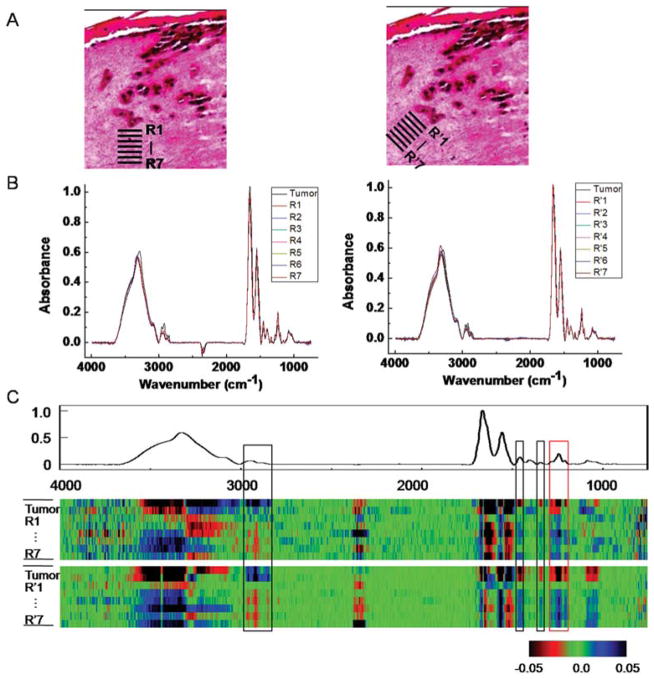
Engineered tissues can provide models for imaging and disease progression and the use of such models is becoming increasingly prevalent. While structural characterization of these systems is documented, a combination of biochemical and structural knowledge is often helpful. Here, we apply Fourier transform infrared (FT-IR) spectroscopic imaging to examine an engineered tissue model of melanoma. We first characterize the biochemical properties and spectral changes in different layers of growing skin. Second, we introduce malignant melanocytes to simulate tumor formation and growth. Both cellular changes associated with tumor formation and growth can be observed. In particular, chemical changes associated with tumor-stromal interactions are observed during the course of tumor growth and appear to influence a 50-100 microm region. The development of this analytical approach combining engineered tissue with spectroscopy, imaging and computation will allow for quality control and standardization in tissue engineering and novel scientific insight in cancer progression.
Figures

Similar articles
-
Infrared and Raman Spectroscopic Studies of Molecular Disorders in Skin Cancer.In Vivo. 2019 Mar-Apr;33(2):567-572. doi: 10.21873/invivo.11512. In Vivo. 2019. PMID: 30804143 Free PMC article.
-
FTIR microspectroscopy of melanocytic skin lesions: a preliminary study.Analyst. 2010 Dec;135(12):3213-9. doi: 10.1039/c0an00505c. Epub 2010 Oct 18. Analyst. 2010. PMID: 20953511
-
FT-IR Spectroscopy Study in Early Diagnosis of Skin Cancer.In Vivo. 2017 Nov-Dec;31(6):1131-1137. doi: 10.21873/invivo.11179. In Vivo. 2017. PMID: 29102935 Free PMC article.
-
FT-IR imaging of native and tissue-engineered bone and cartilage.Biomaterials. 2007 May;28(15):2465-78. doi: 10.1016/j.biomaterials.2006.11.043. Epub 2006 Dec 18. Biomaterials. 2007. PMID: 17175021 Free PMC article. Review.
-
Chemical mapping of tumor progression by FT-IR imaging: towards molecular histopathology.Trends Biotechnol. 2006 Oct;24(10):455-62. doi: 10.1016/j.tibtech.2006.08.005. Epub 2006 Aug 28. Trends Biotechnol. 2006. PMID: 16935373 Review.
Cited by
-
Label-free characterization of cancer-activated fibroblasts using infrared spectroscopic imaging.Biophys J. 2011 Sep 21;101(6):1513-21. doi: 10.1016/j.bpj.2011.07.055. Epub 2011 Sep 20. Biophys J. 2011. PMID: 21943433 Free PMC article.
-
Real-time interactive data mining for chemical imaging information: application to automated histopathology.BMC Bioinformatics. 2013 May 8;14:156. doi: 10.1186/1471-2105-14-156. BMC Bioinformatics. 2013. PMID: 23651487 Free PMC article.
-
Improving prediction of prostate cancer recurrence using chemical imaging.Sci Rep. 2015 Mar 4;5:8758. doi: 10.1038/srep08758. Sci Rep. 2015. PMID: 25737022 Free PMC article.
-
Engineering Heterogeneous Tumor Models for Biomedical Applications.Adv Sci (Weinh). 2024 Jan;11(1):e2304160. doi: 10.1002/advs.202304160. Epub 2023 Nov 9. Adv Sci (Weinh). 2024. PMID: 37946674 Free PMC article. Review.
-
Application of mid-infrared (MIR) microscopy imaging for discrimination between follicular hyperplasia and follicular lymphoma in transgenic mice.Analyst. 2015 Sep 21;140(18):6363-72. doi: 10.1039/c5an01072a. Analyst. 2015. PMID: 26236782 Free PMC article.
References
-
- Melanoma Study Group of the Mayo Clinic Cancer Center. Mayo Clin Proc. 2007;82:364–380. - PubMed
-
- Thompson JF, Scolyer RA, Kefford RF. Lancet. 2005;365:687–701. - PubMed
-
- James WD, Berger TG, Elston D. Andrews’ Diseases of the Skin. 9. Philadelphia: 2000. pp. 881–889.
-
- Elder DE. Clin Cancer Res. 2006;12:2308s–2311s. - PubMed
-
- Hsu MY, Meier F, Herlyn M. Differentiation. 2002;70:522–536. - PubMed
Publication types
MeSH terms
Grants and funding
LinkOut - more resources
Full Text Sources
Medical