

Transcriptional regulation of the CRK/DUF26 group of receptor-like protein kinases by ozone and plant hormones in Arabidopsis
- PMID: 20500828
- PMCID: PMC3095361
- DOI: 10.1186/1471-2229-10-95
Transcriptional regulation of the CRK/DUF26 group of receptor-like protein kinases by ozone and plant hormones in Arabidopsis
Abstract
Background: Plant Receptor-like/Pelle kinases (RLK) are a group of conserved signalling components that regulate developmental programs and responses to biotic and abiotic stresses. One of the largest RLK groups is formed by the Domain of Unknown Function 26 (DUF26) RLKs, also called Cysteine-rich Receptor-like Kinases (CRKs), which have been suggested to play important roles in the regulation of pathogen defence and programmed cell death. Despite the vast number of RLKs present in plants, however, only a few of them have been functionally characterized.
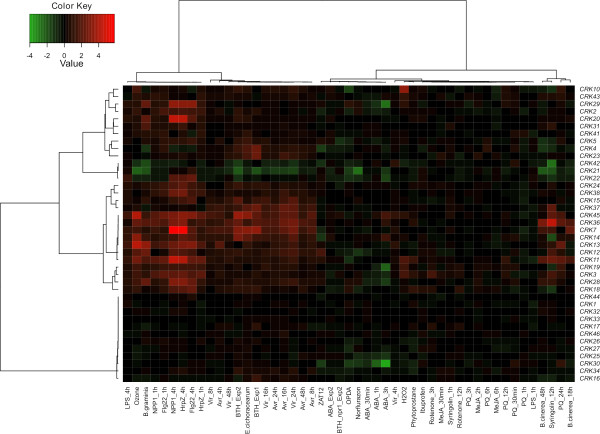
Results: We examined the transcriptional regulation of all Arabidopsis CRKs by ozone (O3), high light and pathogen/elicitor treatment - conditions known to induce the production of reactive oxygen species (ROS) in various subcellular compartments. Several CRKs were transcriptionally induced by exposure to O3 but not by light stress. O3 induces an extracellular oxidative burst, whilst light stress leads to ROS production in chloroplasts. Analysis of publicly available microarray data revealed that the transcriptional responses of the CRKs to O3 were very similar to responses to microbes or pathogen-associated molecular patterns (PAMPs). Several mutants altered in hormone biosynthesis or signalling showed changes in basal and O3-induced transcriptional responses.
Conclusions: Combining expression analysis from multiple treatments with mutants altered in hormone biosynthesis or signalling suggest a model in which O3 and salicylic acid (SA) activate separate signaling pathways that exhibit negative crosstalk. Although O3 is classified as an abiotic stress to plants, transcriptional profiling of CRKs showed strong similarities between the O3 and biotic stress responses.
Figures


 . Similar ROS production in the apoplast takes place after infection of a plant with a pathogen or treatments with pathogen derived elicitors (PAMPs). ROS is hypothetically perceived via a "ROS receptor" which could sense ROS directly via protein modification, or via sensing of modified apoplastic proteins or other molecules that react with ROS. The perception of ROS initiates down-stream signalling events. H2O2 is also able to cross the plasma membrane and enter the cells. Inside the cell, the signalling pathway is split into two pathways. In the ROS pathway DND1/CNGC2 mediates a required step of the signalling pathway and JA and ET act as positive regulators, and SA and NPR1 are negative regulators. In the SA pathway ROS or pathogens activate SA biosynthesis via ICS1; and NPR1 is a required component. Since NPR1 is a positive regulator of the SA pathway and a negative regulator of the ROS pathway this implies that the separate signalling pathway use different transcription factors and promoter elements to regulate CRK expression, although it might be possible that two different transcription factors could converge on the same promoter element. In addition the pleiotropic nature of the dnd1 mutant, including high SA-levels, could change the place of DND1/CNGC2 in the model - constitutive SA signalling in dnd1 may limit the possibility for O3 to activate the ROS pathway. Through the transcription factors EIN3 and EIL1 ET can repress SID2/ICS1 expression and SA levels. Increased ROS production in the chloroplast activates separate signalling pathway(s) leading to repression of CRK expression. One of these pathways could involve ABA and negative cross talk with the SA pathway.
Similar articles
-
Large-Scale Phenomics Identifies Primary and Fine-Tuning Roles for CRKs in Responses Related to Oxidative Stress.PLoS Genet. 2015 Jul 21;11(7):e1005373. doi: 10.1371/journal.pgen.1005373. eCollection 2015 Jul. PLoS Genet. 2015. PMID: 26197346 Free PMC article.
-
Ozone-induced ethylene production is dependent on salicylic acid, and both salicylic acid and ethylene act in concert to regulate ozone-induced cell death.Plant J. 2002 Nov;32(4):447-56. doi: 10.1046/j.1365-313x.2002.01434.x. Plant J. 2002. PMID: 12445117
-
Cysteine-rich receptor-like kinase CRK5 as a regulator of growth, development, and ultraviolet radiation responses in Arabidopsis thaliana.J Exp Bot. 2015 Jun;66(11):3325-37. doi: 10.1093/jxb/erv143. Epub 2015 May 11. J Exp Bot. 2015. PMID: 25969551 Free PMC article.
-
More questions than answers: insights into potential cysteine-rich receptor-like kinases redox signalling in Arabidopsis.Plant J. 2025 Apr;122(2):e70176. doi: 10.1111/tpj.70176. Plant J. 2025. PMID: 40300149 Free PMC article. Review.
-
Cysteine-rich receptor-like protein kinases: emerging regulators of plant stress responses.Trends Plant Sci. 2023 Jul;28(7):776-794. doi: 10.1016/j.tplants.2023.03.028. Epub 2023 Apr 26. Trends Plant Sci. 2023. PMID: 37105805 Review.
Cited by
-
Multiple roles for UV RESISTANCE LOCUS8 in regulating gene expression and metabolite accumulation in Arabidopsis under solar ultraviolet radiation.Plant Physiol. 2013 Feb;161(2):744-59. doi: 10.1104/pp.112.211375. Epub 2012 Dec 18. Plant Physiol. 2013. PMID: 23250626 Free PMC article.
-
Altering the balance between AOX1A and NDB2 expression affects a common set of transcripts in Arabidopsis.Front Plant Sci. 2022 Nov 15;13:876843. doi: 10.3389/fpls.2022.876843. eCollection 2022. Front Plant Sci. 2022. PMID: 36466234 Free PMC article.
-
Phenomics and transcriptomics analyses reveal deposition of suberin and lignin in the short fiber cell walls produced from a wild cotton species and two mutants.PLoS One. 2023 Mar 9;18(3):e0282799. doi: 10.1371/journal.pone.0282799. eCollection 2023. PLoS One. 2023. PMID: 36893139 Free PMC article.
-
Identification and Characterization of Regulatory Pathways Controlling Dormancy Under Lower Temperature in Alfalfa (Medicago sativa L.).Front Plant Sci. 2022 Jun 2;13:872839. doi: 10.3389/fpls.2022.872839. eCollection 2022. Front Plant Sci. 2022. PMID: 35720528 Free PMC article.
-
The Role of Plasmodesmata-Associated Receptor in Plant Development and Environmental Response.Plants (Basel). 2020 Feb 7;9(2):216. doi: 10.3390/plants9020216. Plants (Basel). 2020. PMID: 32046090 Free PMC article. Review.
References
Publication types
MeSH terms
Substances
LinkOut - more resources
Full Text Sources
Medical
Molecular Biology Databases
