
Genetic structure of the Spanish population

Javier Gayán et al. BMC Genomics. .

Abstract

Background: Genetic admixture is a common caveat for genetic association analysis. Therefore, it is important to characterize the genetic structure of the population under study to control for this kind of potential bias.

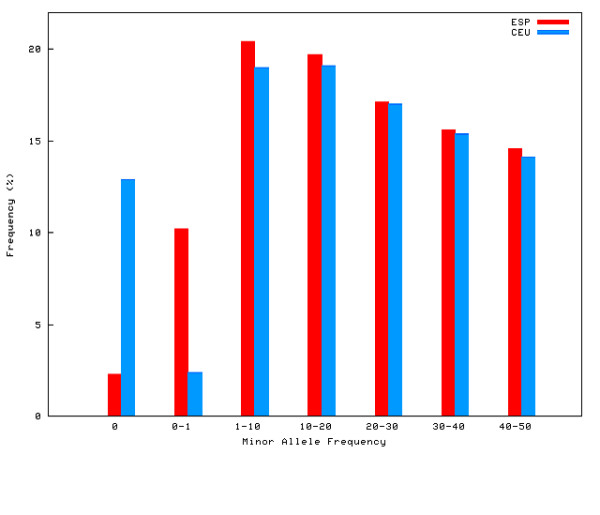
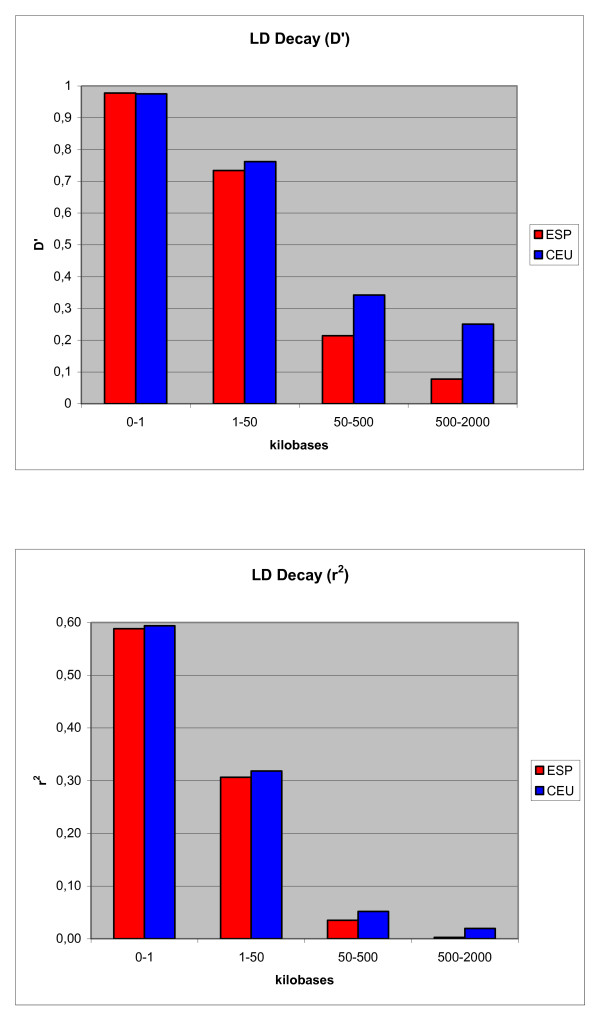
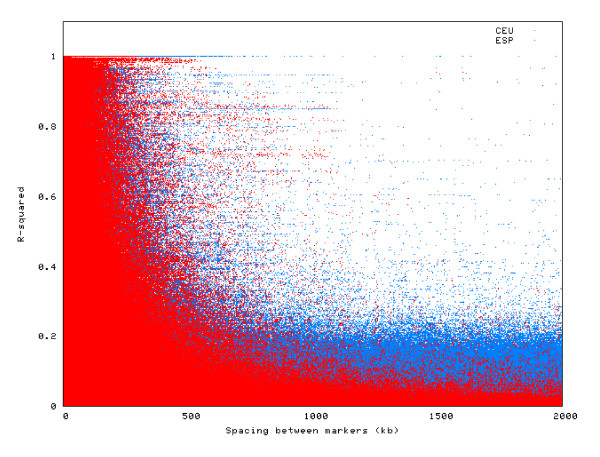
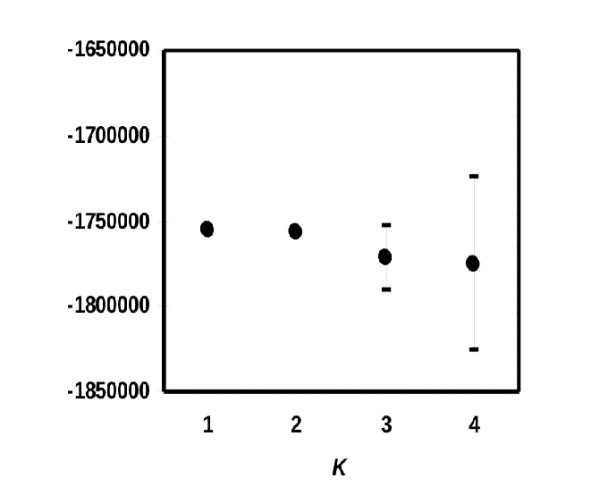
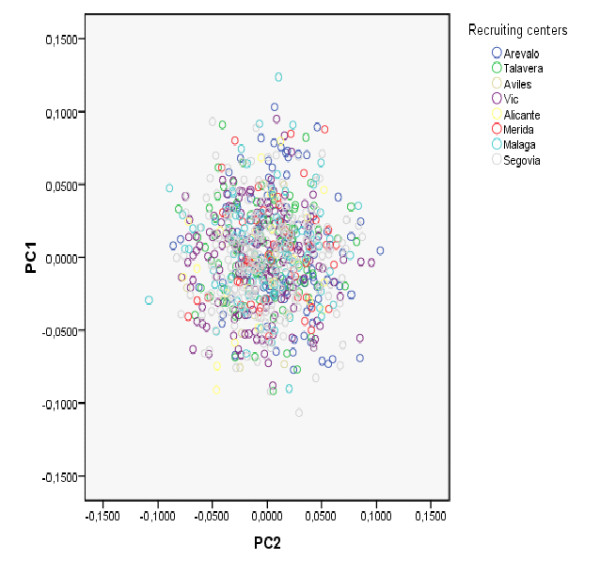
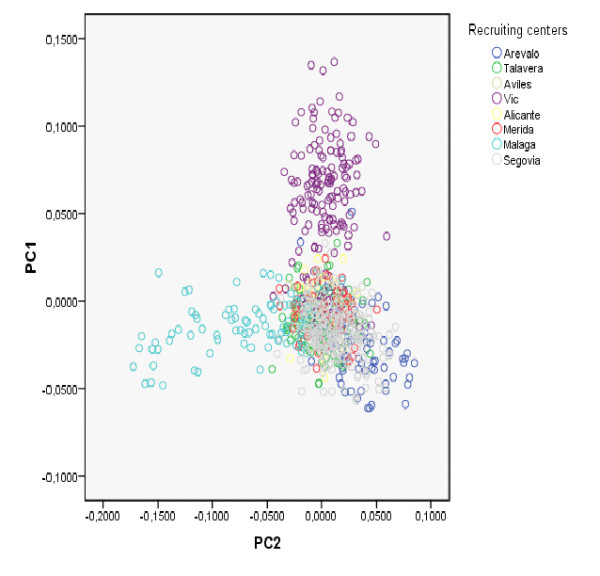
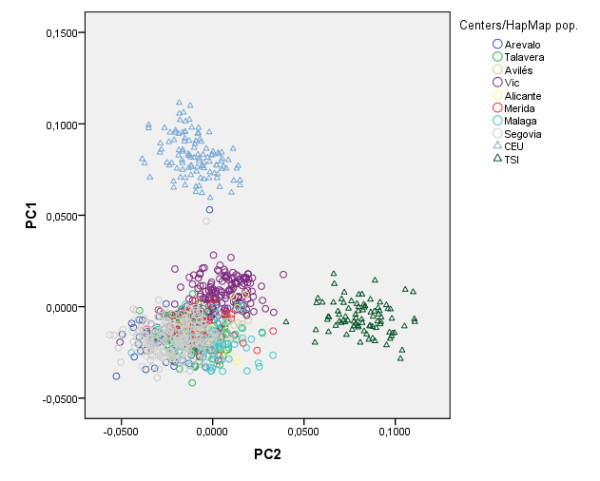
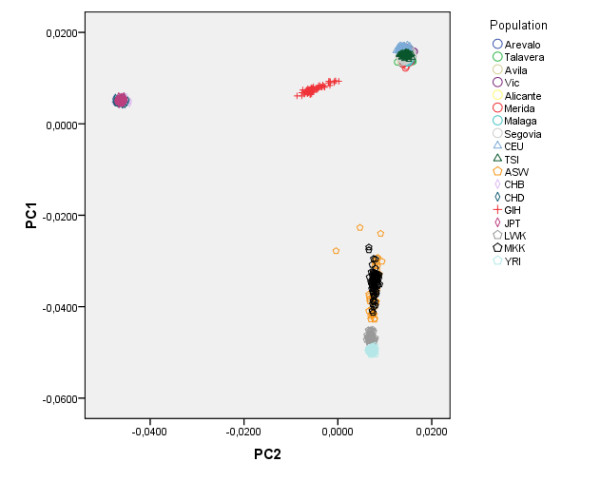
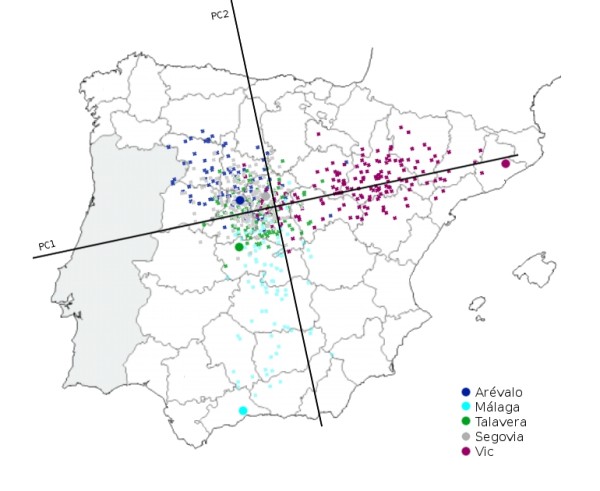
Results: In this study we have sampled over 800 unrelated individuals from the population of Spain, and have genotyped them with a genome-wide coverage. We have carried out linkage disequilibrium, haplotype, population structure and copy-number variation (CNV) analyses, and have compared these estimates of the Spanish population with existing data from similar efforts.

Conclusions: In general, the Spanish population is similar to the Western and Northern Europeans, but has a more diverse haplotypic structure. Moreover, the Spanish population is also largely homogeneous within itself, although patterns of micro-structure may be able to predict locations of origin from distant regions. Finally, we also present the first characterization of a CNV map of the Spanish population. These results and original data are made available to the scientific community.


Figures

Figure 1
Figure 1
Allele Frequencies. Minor allele frequency distribution in the Spanish (ESP, in red) and CEU Hapmap (in blue) samples. Results show that the frequency distribution of common SNPs (MAF = 10 - 50%) are very similar in the two populations.
Figure 2
Figure 2
LD decay, represented as D' and r2 averages for several SNP-distance ranges, in the Spanish (ESP, in red) and CEU Hapmap (in blue) samples. It is shown that, in general, LD decreases as genetic distance increases.
Figure 3
Figure 3
Two-locus LD values (r2) for all genomewide pairs of SNPs less than 2 megabases apart, in the Spanish (ESP, in red) and CEU Hapmap (in blue) samples. This figure shows graphically how LD decreases exponentially with genetic distance, and it also displays the large variability around this general trend.
Figure 4
Figure 4
Structure Analysis of the Spanish sample. Mean L(K) +/- Standard Deviation (in brackets) over ten runs for each value of K (1, 2, 3 and 4). The best mean likelihoods were obtained assuming one single population (K = 1) and two populations (K = 2).
Figure 5
Figure 5
PC results (marker subset A) for Spanish sample. Distribution of Spanish individuals according to the top two Principal Components, using SNP marker subset A which includes only 2,050 unlinked SNPs (two-locus r2 < 0.011).
Figure 6
Figure 6
PC results (marker subset B) for Spanish sample. Scatter plot of the top two Principal Components from the analysis of the Spanish sample, using SNP marker subset B which includes 102,850 SNPs (two-locus r2 < 0.8; Long-range LD regions excluded from analysis).
Figure 7
Figure 7
PC results (marker subset B) for European samples. Scatter plot of the top two Principal Components from the analysis of the Spanish sample and two European HapMap samples, using SNP marker subset B. HapMap sample acronyms stand for: CEU: Utah residents with ancestry from northern and western Europe; TSI: Toscani in Italy.
Figure 8
Figure 8
PC results (marker subset B) for Worldwide samples. Scatter plot of the top two Principal Components from the analysis of the Spanish sample and multiple HapMap samples, using SNP marker subset B. HapMap sample acronyms stand for: European (CEU: Utah residents with ancestry from northern and western Europe; and TSI: Toscani in Italy), African (ASW: African ancestry from Southwest USA; LWK: Luhya in Webuye, Kenya; MKK: Maasai in Kinyawa, Kenya; YRI: Yoruba in Ibadan, Nigeria) and Asian ancestry (CHB: Han Chinese in Beijing, China; CHD: Chinese in Metropolitan Denver, Colorado; GIH: Gujarati Indians in Houston, Texas; JPT Japanese in Tokyo, Japan).
Figure 9
Figure 9
PC results (marker subset B) for Spanish sample over map of Spain. Results of the Principal Components analysis overlying the map of Spain, with recruiting centers marked with bigger circles (for clarity, only recruiting centers contributing more than 10% of the total sample size are shown).

Similar articles

Cited by

References

    1. The International HapMap Consortium. The International HapMap Project. Nature. 2003;426:789–796. doi: 10.1038/nature02168. - DOI - PubMed
    1. The International HapMap Consortium. A haplotype map of the human genome. Nature. 2005;437:1299–1320. doi: 10.1038/nature04226. - DOI - PMC - PubMed
    1. The International HapMap Consortium. A second generation human haplotype map of over 3.1 million SNPs. Nature. 2007;449:851–861. doi: 10.1038/nature06258. - DOI - PMC - PubMed
    1. Marchini J, Cardon LR, Phillips MS, Donnelly P. The effects of human population structure on large genetic association studies. Nat Genet. 2004;36:512–517. doi: 10.1038/ng1337. - DOI - PubMed
    1. Lao O, Lu TT, Nothnagel M, Junge O, Freitag-Wolf S, Caliebe A, Balascakova M, Bertranpetit J, Bindoff LA, Comas D. et al.Correlation between genetic and geographic structure in Europe. Curr Biol. 2008;18:1241–1248. doi: 10.1016/j.cub.2008.07.049. - DOI - PubMed

Publication types

LinkOut - more resources