. 2010 May 26:11:279.
doi: 10.1186/1471-2105-11-279.

Importance of replication in analyzing time-series gene expression data: corticosteroid dynamics and circadian patterns in rat liver

Affiliations

Importance of replication in analyzing time-series gene expression data: corticosteroid dynamics and circadian patterns in rat liver

Tung T Nguyen et al. BMC Bioinformatics. .

Abstract

Background: Microarray technology is a powerful and widely accepted experimental technique in molecular biology that allows studying genome wide transcriptional responses. However, experimental data usually contain potential sources of uncertainty and thus many experiments are now designed with repeated measurements to better assess such inherent variability. Many computational methods have been proposed to account for the variability in replicates. As yet, there is no model to output expression profiles accounting for replicate information so that a variety of computational models that take the expression profiles as the input data can explore this information without any modification.

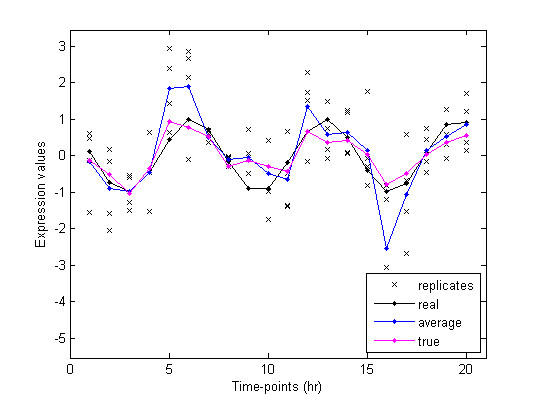
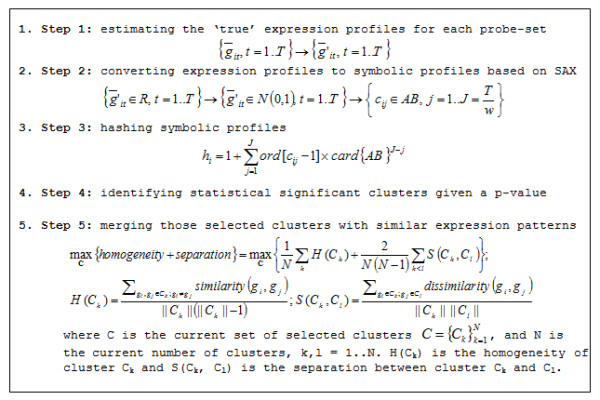
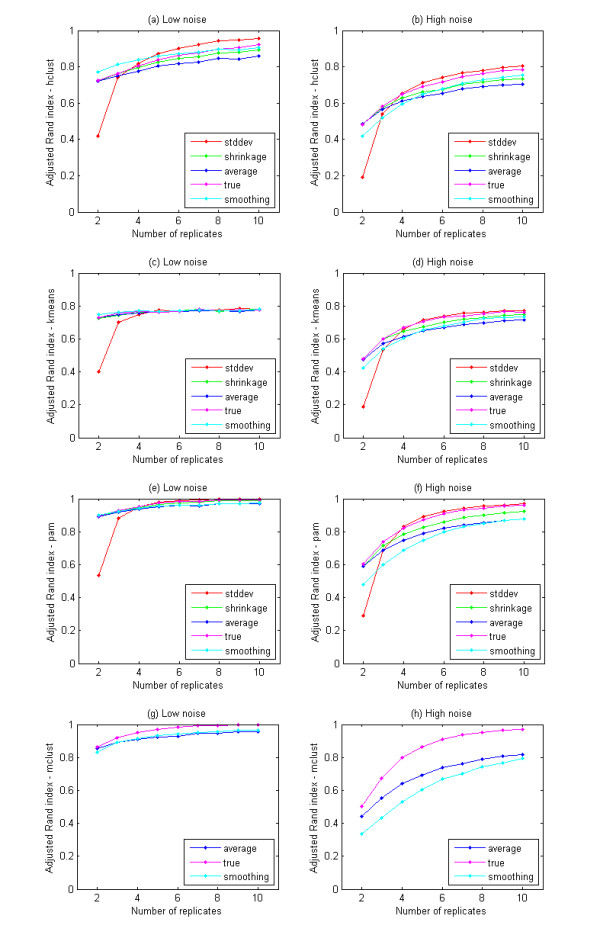
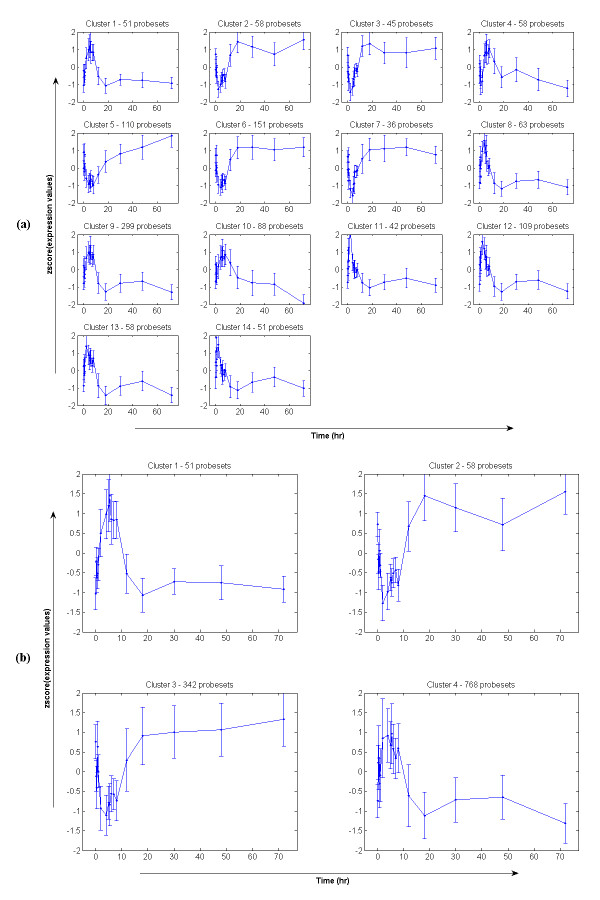
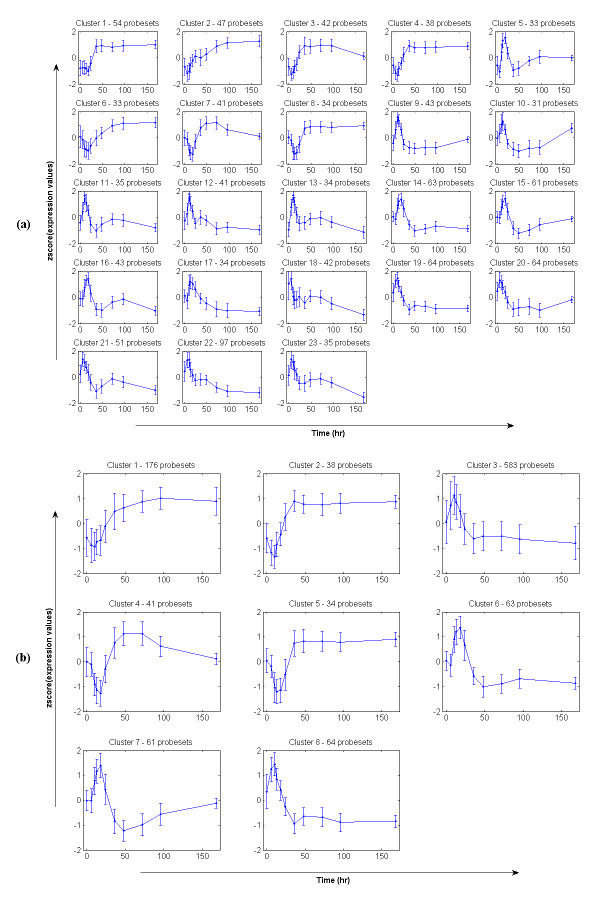
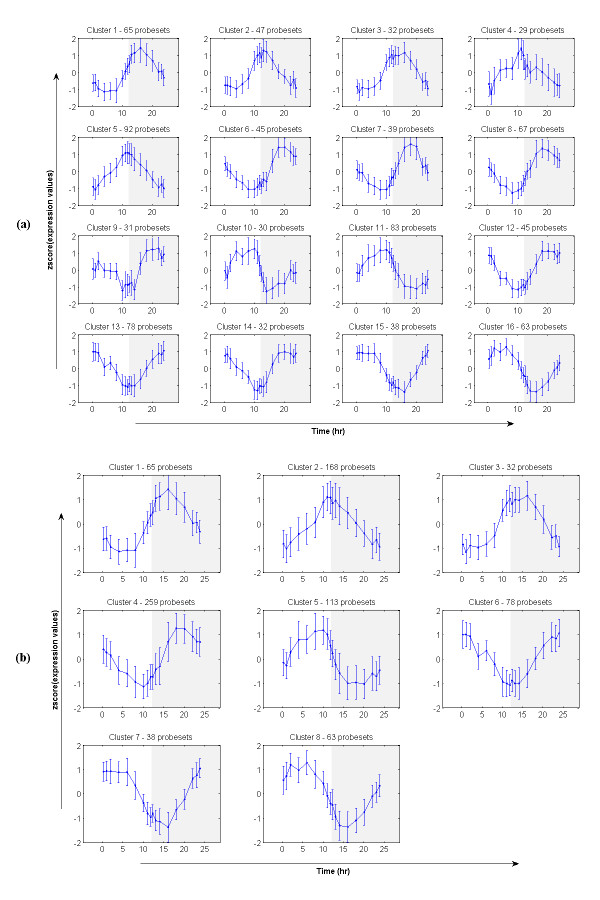
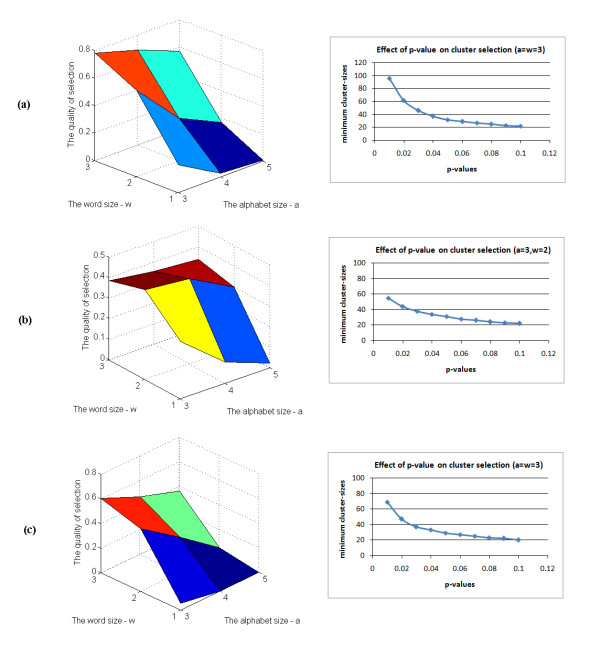
Results: We propose a methodology which integrates replicate variability into expression profiles, to generate so-called 'true' expression profiles. The study addresses two issues: (i) develop a statistical model that can estimate 'true' expression profiles which are more robust than the average profile, and (ii) extend our previous micro-clustering which was designed specifically for clustering time-series expression data. The model utilizes a previously proposed error model and the concept of 'relative difference'. The clustering effectiveness is demonstrated through synthetic data where several methods are compared. We subsequently analyze in vivo rat data to elucidate circadian transcriptional dynamics as well as liver-specific corticosteroid induced changes in gene expression.

Conclusions: We have proposed a model which integrates the error information from repeated measurements into the expression profiles. Through numerous synthetic and real time-series data, we demonstrated the ability of the approach to improve the clustering performance and assist in the identification and selection of informative expression motifs.


Figures

Figure 1
Figure 1
The 'true' expression profiles are more robust than the average ones 'real' is the actual profile from simulated data without noise. 'replicates' are obtained when noise is added to the actual value at each time-point. The average profile is showed to be more deviated from the actual profile than the 'true' profile.
Figure 2
Figure 2
Computational framework for clustering and selection.
Figure 3
Figure 3
The performance of typical clustering methods on different error-measurement integrated approaches. 'stddev' represents for the clustering performance on synthetic data using the approach with the SD-weighted correlation coefficient metric; similarly, 'shrinkage' is for the approach with the shrinkage correlation coefficient metric; 'average' is for the clustering performance on average profiles; 'true' is for that on 'true' profiles; and 'smoothing' is for that when using method 'spline' to infer the expression profiles and then clustering. The horizontal axis shows the corresponding number of replicates in the dataset while the vertical axis demonstrates the clustering performance of the corresponding approach (the higher the better). Results are the average of clustering accuracies over 1000 randomly generated synthetic datasets.
Figure 4
Figure 4
Selected expression patterns from the acute corticosteroid dataset; (a) before merging and (b) after merging. The horizontal axis is seventeen time-points (0, 0.25, 0.5, 0.75, 1, 2, 4, 5, 5.5, 6, 7, 8, 12, 18, 30, 48, 72 hours) and the vertical axis is the normalized (z-score) of expression values from 'true' expression profiles. Error bars are two standard deviations of expression values at each particular time-point.
Figure 5
Figure 5
Selected expression patterns from the chronic corticosteroid dataset; (a) before merging and (b) after merging. The horizontal axis is eleven time-points (0, 6, 10, 13, 18, 24, 36, 48, 72, 96, 168 hours) and the vertical axis is the normalized (z-score) of expression values from 'true' expression profiles. Error bars are two standard deviations of expression values at each particular time-point.
Figure 6
Figure 6
Selected expression patterns from the circadian dataset; (a) before merging and (b) after merging. The horizontal axis is eighteen time-points (0.25, 1, 2, 4, 6, 8, 10, 11, 11.75, 12.25, 13, 14, 16, 18, 20, 22, 23, 23.75 hours) and the vertical axis is the normalized (z-score) of expression values from 'true' expression profiles. Error bars are two standard deviations of expression values at each particular time-point.
Figure 7
Figure 7
Effects of parameters on the selection. (a) Illustration results from the acute corticosteroid dataset (left is the optimal parameters for a given dataset and right is the corresponding cluster-size for a given p-value); (b) Illustration results from the chronic corticosteroid dataset; and (c) Illustration results from the circadian dataset.

Similar articles

Cited by

References

    1. Altman N. Replication, variation and normalisation in microarray experiments. Appl Bioinformatics. 2005;4(1):33–44. doi: 10.2165/00822942-200504010-00004. - DOI - PubMed
    1. Churchill GA. Fundamentals of experimental design for cDNA microarrays. Nat Genet. 2002;32(Suppl):490–495. doi: 10.1038/ng1031. - DOI - PubMed
    1. Lee ML, Kuo FC, Whitmore GA, Sklar J. Importance of replication in microarray gene expression studies: statistical methods and evidence from repetitive cDNA hybridizations. Proc Natl Acad Sci USA. 2000;97(18):9834–9839. doi: 10.1073/pnas.97.18.9834. - DOI - PMC - PubMed
    1. Lonnstedt I, Speed T. Replicated microarray data. Statistica Sinica. 2002;12:31–46.
    1. Pan W, Lin J, Le CT. How many replicates of arrays are required to detect gene expression changes in microarray experiments? A mixture model approach. Genome Biol. 2002;3:5. doi: 10.1186/gb-2002-3-5-research0022. - DOI - PMC - PubMed

Publication types

Substances