. 2010 Sep;57(9):2122-34.
doi: 10.1109/TBME.2010.2050319. Epub 2010 May 24.

Estimation of cortical connectivity from EEG using state-space models

Affiliations

Estimation of cortical connectivity from EEG using state-space models

Bing Leung Patrick Cheung et al. IEEE Trans Biomed Eng. 2010 Sep.

Abstract

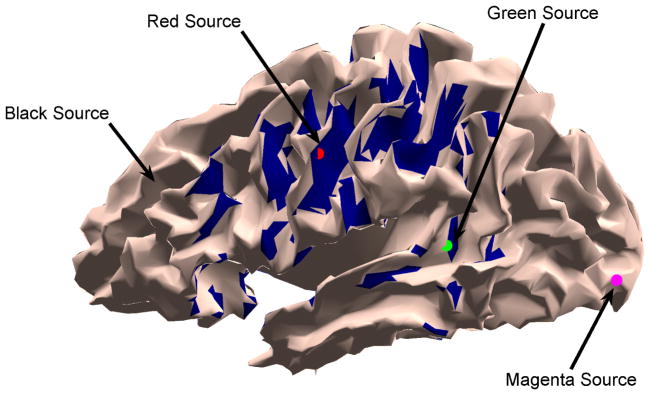
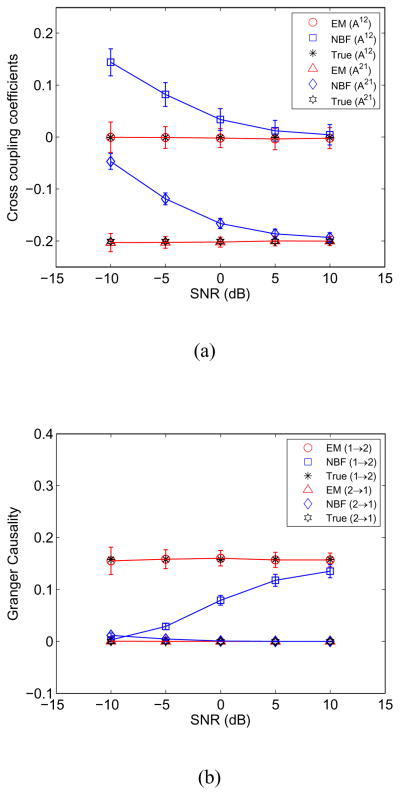
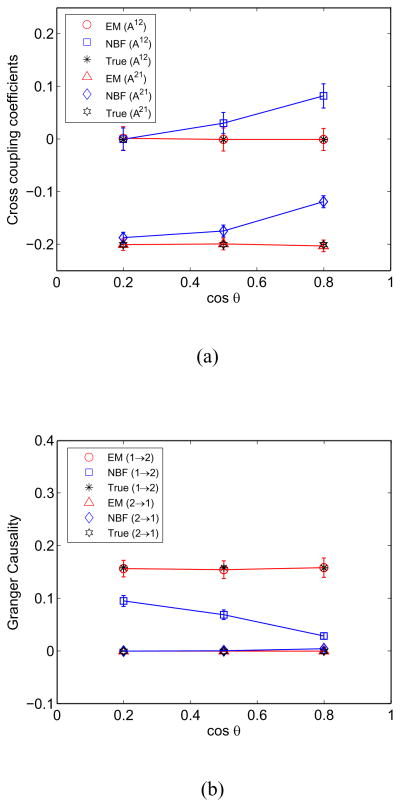
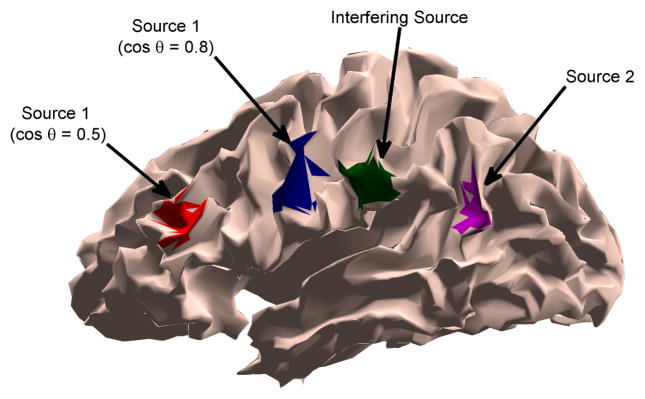
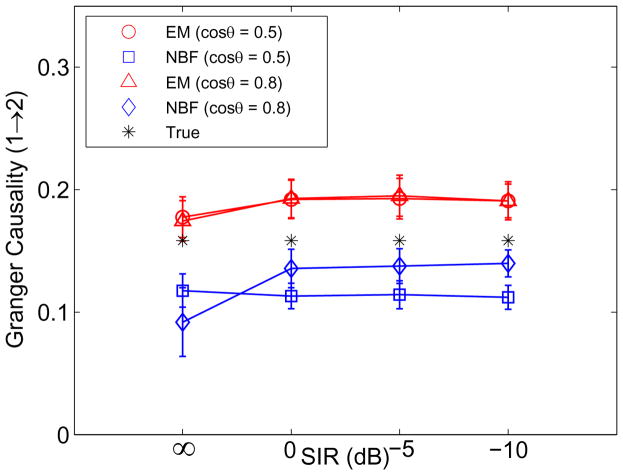
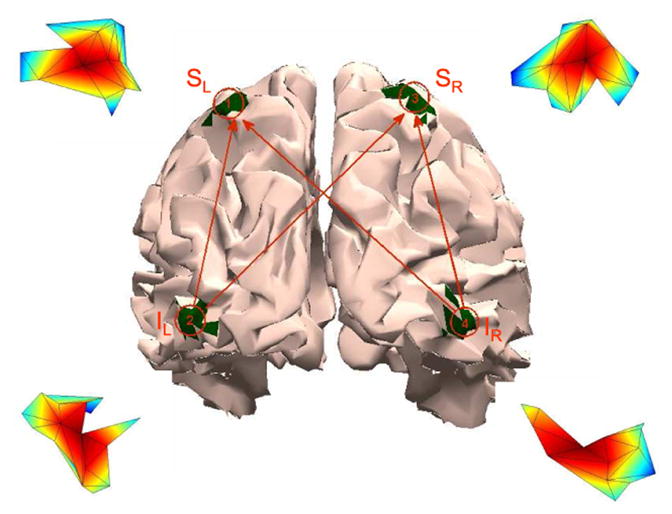
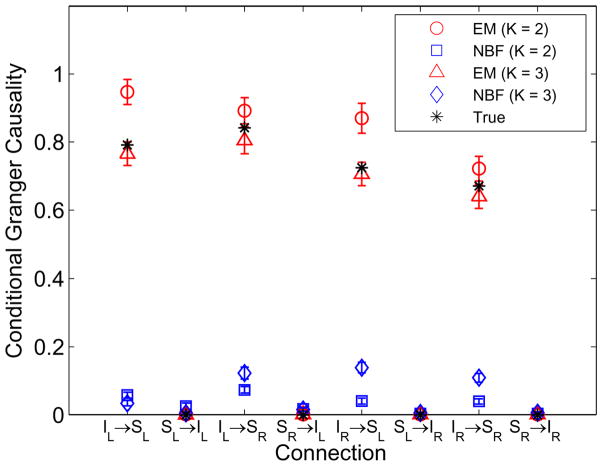
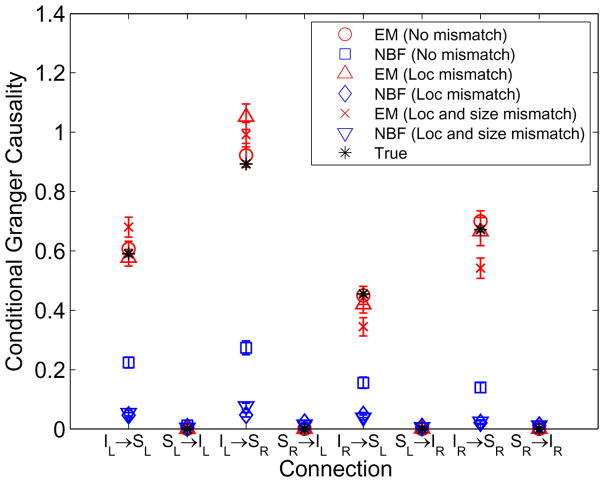
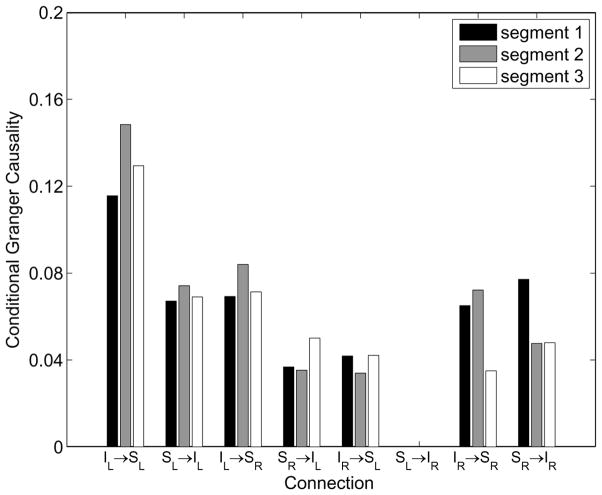
A state-space formulation is introduced for estimating multivariate autoregressive (MVAR) models of cortical connectivity from noisy, scalp-recorded EEG. A state equation represents the MVAR model of cortical dynamics, while an observation equation describes the physics relating the cortical signals to the measured EEG and the presence of spatially correlated noise. We assume that the cortical signals originate from known regions of cortex, but the spatial distribution of activity within each region is unknown. An expectation-maximization algorithm is developed to directly estimate the MVAR model parameters, the spatial activity distribution components, and the spatial covariance matrix of the noise from the measured EEG. Simulation and analysis demonstrate that this integrated approach is less sensitive to noise than two-stage approaches in which the cortical signals are first estimated from EEG measurements, and next, an MVAR model is fit to the estimated cortical signals. The method is further demonstrated by estimating conditional Granger causality using EEG data collected while subjects passively watch a movie.


Figures

Fig. 1
Fig. 1
Dipolar source locations for Example 1 (the black source is hidden in a sulcus). The blue shaded region depicts all source locations that have forward model angles equal or exceeding cos θ = 0.8 with respect to the red source.
Fig. 2
Fig. 2
EM and NBF approach performance as a function of SNR estimated over 100 runs. Error bars denote one standard deviation. (a) MVAR cross coupling coefficients A12 and A21. (b) Granger causality metric from source 1 to source 2 and source 2 to source 1.
Fig. 3
Fig. 3
EM and NBF approach performance as a function of the angle between source forward models estimated over 100 runs at SNR = −5 dB. Error bars denote one standard deviation. (a) MVAR cross coupling coefficients A12 and A21. (b) Granger causality metric from source 1 to source 2 and source 2 to source 1.
Fig. 4
Fig. 4
Two-source and interferer scenarios for Example 2. The green patch is the interferer while the purple patch is source 2. The red and blue patches depict the locations of source 1 for two different scenarios.
Fig. 5
Fig. 5
Estimated and true Granger causality from source 1 to source 2 for a simulated two-node network in the presence of an interfering source as a function of SIR and the angle between the interferer and source 1 forward models at SNR = 5 dB. Error bars denote one standard deviation.
Fig. 6
Fig. 6
Inferior occipital gyrii (IL and IR) and superior parietal lobules (SL and SR) are shown in green on a rear view of the brain. The line drawing superimposed on the brain illustrates the causal influences simulated in Examples 3 and 4 while the insets near each ROI depict the simulated spatial activity distribution
Fig. 7
Fig. 7
Estimated and true conditional Granger causality for the simulated four-node network of Example 3 as depicted in Fig. 6 at SNR = 5 dB. The observation equation (Eq. 14) is designed using either K = 2 or K = 3 basis vectors for each ROI. Error bars denote one standard deviation.
Fig. 8
Fig. 8
Estimated and true conditional Granger causality corresponding to the simulated four-node network depicted in Fig. 6 with ROI mismatch at SNR = 5 dB. Error bars denote one standard deviation.
Fig. 9
Fig. 9
Subject 1 conditional Granger causality metrics estimated during movie viewing for three different segments of data.
Fig. 10
Fig. 10
Histogram of the coefficient of variation for non-homologous connections in all three subjects.

Similar articles

Cited by

References

    1. Lutkepohl H. Introduction to Multiple Time Series Analysis. 2. Berlin: Springer-Verlag; 1993.
    1. Bressler S, Richter C, Chen Y, Ding M. Cortical functional network organization from autoregressive maodeling of local field potential oscillations. Statist Med. 2007;26:3875–3885. - PubMed
    1. Ding M, Chen Y, Bressler L. Granger causality: Basic theory and application to neuroscience. In: Schelter B, Winterhalder M, Timmer J, editors. Handbook of Time Series Analysis. Vol. 17. Weinheim: Wiley; 2006. pp. 437–459.
    1. Bernasconi C, Konig P. On the directionality of cortical interactions studied by structural analysis of electrophysiological recordings. Biol Cybern. 1999 Sept;81(3):199–210. - PubMed
    1. Brovelli A, Ding M, Ledberg A, Chen Y, Nakamura R, Bressler S. Beta oscillations in a large-scale sensorimotor cortical network: Directional influences revealed by granger causality. PNAS. 2004 June;101(26):9849–9854. - PMC - PubMed

Publication types