. 2009 Nov;297(5):G1009-18.
doi: 10.1152/ajpgi.00223.2009.

Identification and functional characterization of the intermediate-conductance Ca(2+)-activated K(+) channel (IK-1) in biliary epithelium

Affiliations

Identification and functional characterization of the intermediate-conductance Ca(2+)-activated K(+) channel (IK-1) in biliary epithelium

Amal K Dutta et al. Am J Physiol Gastrointest Liver Physiol. 2009 Nov.

Abstract

In the liver, adenosine triphosphate (ATP) is an extracellular signaling molecule that is released into bile and stimulates a biliary epithelial cell secretory response via engagement of apical P2 receptors. The molecular identities of the ion channels involved in ATP-mediated secretory responses have not been fully identified. Intermediate-conductance Ca(2+)-activated K(+) channels (IK) have been identified in biliary epithelium, but functional data are lacking. The aim of these studies therefore was to determine the location, function, and regulation of IK channels in biliary epithelial cells and to determine their potential contribution to ATP-stimulated secretion. Expression of IK-1 mRNA was found in both human Mz-Cha-1 biliary cells and polarized normal rat cholangiocyte (NRC) monolayers, and immunostaining revealed membrane localization with a predominant basolateral signal. In single Mz-Cha-1 cells, exposure to ATP activated K(+) currents, increasing current density from 1.6 +/- 0.1 to 7.6 +/- 0.8 pA/pF. Currents were dependent on intracellular Ca(2+) and sensitive to clotrimazole and TRAM-34 (specific IK channel inhibitors). Single-channel recording demonstrated that clotrimazole-sensitive K(+) currents had a unitary conductance of 46.2 +/- 1.5 pS, consistent with IK channels. In separate studies, 1-EBIO (an IK activator) stimulated K(+) currents in single cells that were inhibited by clotrimazole. In polarized NRC monolayers, ATP significantly increased transepithelial secretion which was inhibited by clotrimazole. Lastly, ATP-stimulated K(+) currents were inhibited by the P2Y receptor antagonist suramin and by the inositol 1,4,5-triphosphate (IP3) receptor inhibitor 2-APB. Together these studies demonstrate that IK channels are present in biliary epithelial cells and contribute to ATP-stimulated secretion through a P2Y-IP3 receptor pathway.


Figures

Fig. 1.
Fig. 1.
Characterization of whole cell ATP stimulated currents. Exposure to ATP stimulates both outward and inward currents in human Mz-Cha-1 biliary epithelial cells. Whole cell currents were measured during basal conditions and during exposure to ATP (50 μM) (methods). A: representative whole cell recording. Currents measured at −80 mV (●), representing ICl, and at 0 mV (○), representing IK+, are shown. ATP exposure is indicated by the bar. A voltage-step protocol (test potentials between −100 mV and +100 mV in 20-mV increments) was obtained a★ (basal), b★ (maximal outward current response), and c★ (maximal inward current response) as indicated. The current-voltage (I-V) plot shown in B was generated from these protocols. B: I-V relationship of whole cell currents during basal (▿) and ATP-stimulated maximal outward current (●) and maximal inward current (○) conditions.
Fig. 2.
Fig. 2.
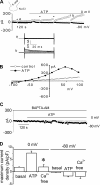
Characterization of whole cell ATP stimulated outward currents. Exposure to ATP stimulates outward currents in human Mz-Cha-1 biliary epithelial cells when intracellular KCl was replaced with K-aspartate (methods). Whole cell currents were measured during basal conditions and during exposure to ATP (50 μM) (methods). A: representative whole cell recording. Currents measured at 0 mV (○), representing IK+, and at −80 mV (●), representing ICl, are shown. ATP exposure is indicated by the bar. A voltage-step protocol (test potentials between −100 mV and +100 mV in 20-mV increments) was obtained at a★ (basal) and b★ (maximal current response) as indicated. The I-V plot shown in 2B was generated from these protocols. B: I-V relationship of whole cell currents during basal (○) and ATP-stimulated (●) conditions. C: representative ATP-stimulated whole cell current tracings measured at 0 and −80 mV in the absence of intracellular Ca2+ (pretreated with BAPTA-AM 50 μM for 5–10 min and EGTA 2 mM in pipette solution). D: cumulative data demonstrating magnitude of ATP-stimulated currents in control conditions or after removal of intracellular Ca2+ (pretreated with BAPTA-AM 50 μM for 5–10 min and EGTA 2 mM in pipette solution). Values represent maximum current density measured at 0 and −80 mV (n = 3–10 each). *ATP-stimulated currents were significantly inhibited (P < 0.05 for each).
Fig. 3.
Fig. 3.
Pharmacological profile of ATP-stimulated whole cell currents. A and B: representative ATP-stimulated whole cell current tracings measured at 0 and −80 mV in the presence or absence of the nonspecific K+ channel blocker BaCl2 (5 mM) and the intermediate-conductance Ca2+-activated K+ (IK) channel inhibitor clotrimazole (10 μM) in the bath. Application of ATP and K+ channel inhibitors are indicated by bar. C: cumulative data demonstrating magnitude of ATP-stimulated currents in the presence or absence of the K+ channel inhibitors BaCl2 (5 mM), clotrimazole (10 μM), TRAM-34 (20 μM), and apamin (50 nM). Values represent % of maximum control current density (pA/pF) measured at 0 mV (n = 3–18). *ATP-stimulated currents were significantly inhibited vs. control (P < 0.05); #significantly different from Tram-34 (P < 0.05).
Fig. 4.
Fig. 4.
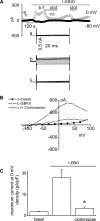
1-EBIO activates K+ currents in human Mz-Cha-1 biliary cells. Whole cell currents were measured during basal conditions and during exposure to 1-EBIO (600 μM). A: representative whole cell recording. Currents measured at −80 mV (●), representing ICl, and at 0 mV (○), representing IK+, are shown. Applications of 1-EBIO and clotrimazole (clot) are indicated by the bars. A voltage-step protocol (test potentials between −100 mV and +100 mV in 20-mV increments) was obtained at a☆ (basal), b☆ (maximal outward current response), and c☆ (current response after clotrimazole) as indicated. The I-V plot shown in B was generated from these protocols. B: I-V relationship of whole cell currents during basal (●), 1-EBIO-stimulated (○), and 1-EBIO-stimulated currents after exposure to clotrimazole (▵). C: cumulative data demonstrating maximum current density (pA/pF) measured at 0 mV under basal conditions and after exposure to 1-EBIO (600 μM) in the presence or absence of the IK-1 channel inhibitor clotrimazole (10 μM). Values represent maximum current density (pA/pF) measured at 0 mV (n = 7–8 each). *1-EBIO-stimulated currents were significantly inhibited (P < 0.01).
Fig. 5.
Fig. 5.
ATP exposure activates unitary K+ currents. A: single ion channel currents were measured in the cell-attached configuration. Currents are shown at the pipette potentials (Vp, as indicated). Under basal conditions few spontaneous openings were measured (left). Exposure to ATP (50 μM) caused rapid appearance of single-channel events at different voltages (right). The channel opening and closing are indicated by O and C, respectively. B: replacement of the monovalent cations (Na+, K+) in the patch pipette with tetraethyl ammonium (TEA) and adding a K+ channel blocker BaCl2 completely inhibited ATP-stimulated currents (top traces); similarly, the specific IK-1 channel blocker clotrimazole also inhibited ATP-stimulated single-channel currents (bottom traces). C: current-voltage relationships for the ATP-stimulated K+ channel currents recorded in cell-attached patch. The dotted line represents the linear best fit at the negative potentials recorded with standard extracellular and K-gluconate-rich pipette solutions. The single-channel conductance was calculated from this slope and found to be 46.2 ± 1.5 pS.
Fig. 6.
Fig. 6.
Expression and localization of IK-1 protein in human MZ-cha-1 cells and normal rat cholangiocyte (NRC) monolayers. A: RT-PCR, as described in methods, was performed in Mz-cha-1 and NRC cells. The IK-1 primer pair 1 and the IK-1 primer pair 2 were used to detect IK-1 expression in Mz-cha cells (left), whereas IK-1 mRNA was identified in NRC cells by use of IK-1 primer pair 2 (right). A human hepatic stellate cell line, HSC, was used as a negative control, and a 100-bp DNA ladder was used to delineate the size of respective amplicons. B: membrane localization of IK-1 protein on NRC. Double staining for membrane F-actin (red) and IK-1 (green) in single NRC demonstrates presence of IK-1 channel protein along cell membrane, both apical and basolateral side (green) with predominance in lateral compartments (left). Single confocal image of control cell stained with same antibody after preincubation with IK-1 (SK4) peptide and stained for membrane F-actin (right). Bottom: z-axis view; arrowheads: A, apical, BL, basolateral membrane.
Fig. 7.
Fig. 7.
Pharmacological inhibition of IK-1 inhibits ATP-stimulated transepithelial secretion in polarized cholangiocyte monolayers. Short-circuit current (Isc) across NRC monolayers was measured under voltage-clamp conditions in an Ussing chamber. In these representative recordings agonists are added to the apical chamber. A: addition of ATP (200 μM) resulted in significant increase in the magnitude of the Isc (top tracing). Addition of clotrimazole (20 μM) to apical and basolateral chambers significantly inhibited the ATP-stimulated Isc (bottom tracing). Addition of BaCl2 further decreased the Isc. B: cumulative data showing the average change in percentage of Isc after addition different K+ channel inhibitors, in the presence of ATP. The y-axis values are reported as percent of maximal control Isc. *Significantly inhibited the ATP-induced increase in Isc (P < 0.05). Each bar represents 4–12 trials.
Fig. 8.
Fig. 8.
Effects of pharmacological inhibition of P2Y- or inositol 1,4,5-triphosphate (IP3) receptors on ATP-stimulated K+ currents. Whole cell patch clamp studies were performed according to the protocol described in Fig. 1. A and B: representative recordings of ATP-stimulated (50 μM) currents in the presence of suramin (100 μM) (A) or 2-APB (100 μM) (B). C: cumulative data demonstrating effects of P2Y or IP3 inhibition on ATP-stimulated current density. *Suramin or 2-APB significantly (P < 0.05) inhibited ATP-stimulated currents. Values represent maximum current density (pA/pF) measured at 0 mV, respectively (n = 4 −10 each).
Fig. 9.
Fig. 9.
Proposed model of ATP-stimulated secretion in biliary epithelium. Extracellular ATP in bile binds purinergic (P2) receptors on the apical cholangiocyte membrane. P2Y receptors are G protein-linked receptors and generate IP3 through PLC activation. IP3 increases intracellular Ca2+ by release from intracellular stores. Increases in intracellular Ca2+ activate apical membrane Cl channels that represent the driving force for biliary secretion. The increase in luminal Cl drives Cl/HCO3 exchange. Membrane Ca2+-activated K+ channels (IK-1 and SK2) function in a complementary manner and are responsible for continued secretion by hyperpolarizing the cell membrane. The molecular identity of the Ca2+-activated Cl channel is unknown. IP3-R, IP3 receptor; PLC, phospholipase C; SK2, small-conductance Ca2+-activated K+ channel 2; IK-1, intermediate-conductance Ca2+-activated K+ channel 1.

Similar articles

Cited by

References

    1. Barfod ET, Moore AL, Roe MW, Lidofsky SD. Ca2+-activated IK1 channels associate with lipid rafts upon cell swelling and mediate volume recovery. J Biol Chem 282: 8984–8993, 2007 - PubMed
    1. Basavappa S, Middleton JP, Mangel A, McGill J, Cohn JA, Fitz JG. Cl− and K+ transport in human biliary cell lines. Gastroenterology 104: 1796–1805, 1993 - PubMed
    1. Cohn JA, Strong TA, Picciotto MA, Nairn AC, Collins FS, Francis S, Fitz JG. Localization of CFTR in human bile duct epithelial cells. Gastroenterology 105: 1857–1864, 1993 - PubMed
    1. de-Allie FA, Bolsover SR, Nowicky AV, Strong PN. Characterization of Ca2+-activated 86Rb+ fluxes in rat C6 glioma cells: a system for identifying novel IKCa-channel toxins. Br J Pharmacol 117: 479–487, 1996 - PMC - PubMed
    1. Deng XL, Lau CP, Lai K, Cheung KF, Lau GK, Li GR. Cell cycle-dependent expression of potassium channels and cell proliferation in rat mesenchymal stem cells from bone marrow. Cell Prolif 40: 656–670, 2007 - PMC - PubMed

Publication types

MeSH terms

LinkOut - more resources