

Estrogen receptor beta2 and beta5 are associated with poor prognosis in prostate cancer, and promote cancer cell migration and invasion
- PMID: 20501637
- PMCID: PMC2891483
- DOI: 10.1677/ERC-09-0294
Estrogen receptor beta2 and beta5 are associated with poor prognosis in prostate cancer, and promote cancer cell migration and invasion
Abstract
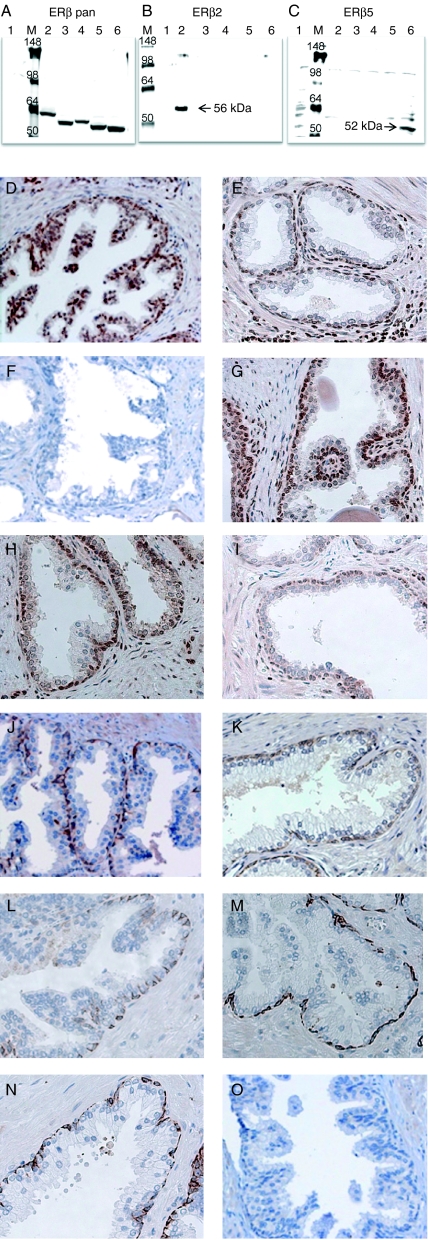
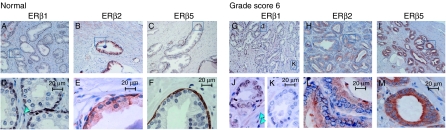
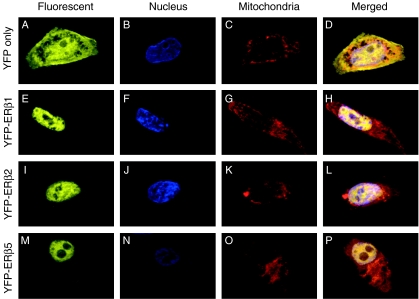
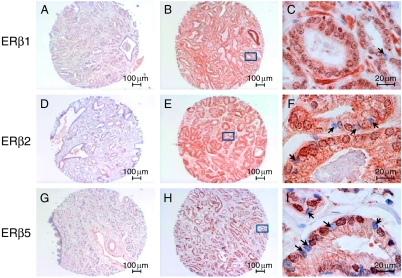
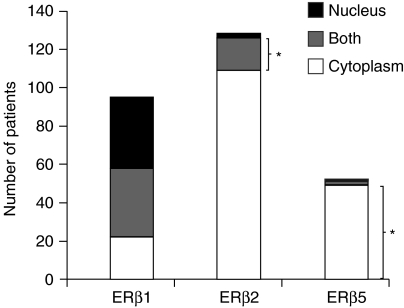
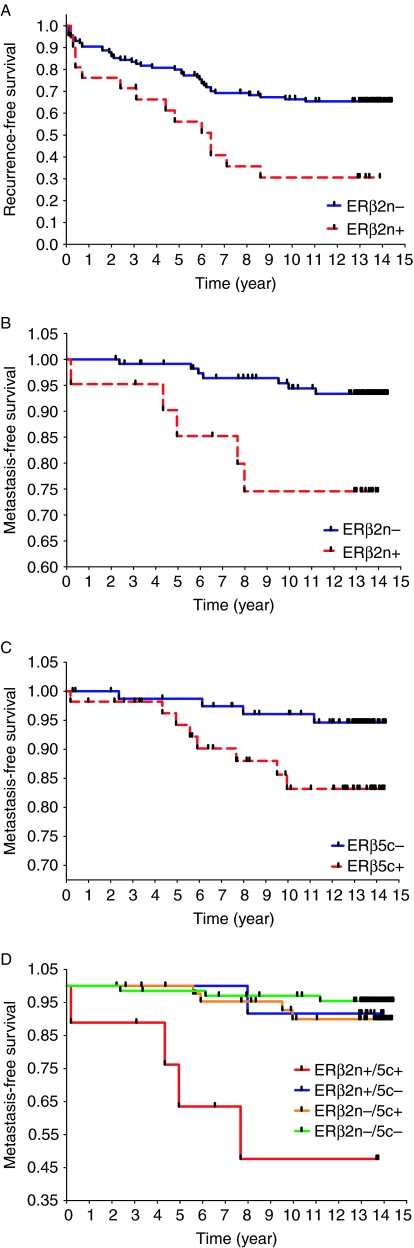
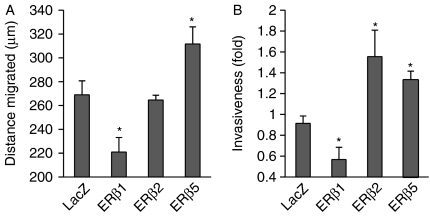
Estrogens play a pivotal role in the development and progression of prostate cancer (PCa). Their actions are mediated by estrogen receptors (ERs), particularly ERbeta in the prostate epithelium. With the discovery of ERbeta isoforms, data from previous studies that focused principally on the wild-type ERbeta (ERbeta1) may not be adequate in explaining the still controversial role of ERbeta(s) in prostate carcinogenesis. In this study, using newly generated isoform-specific antibodies, immunohistochemistry (IHC) was performed on a tumor microarray comprised of 144 specimens. IHC results were correlated with pathological and clinical follow-up data to delineate the distinct roles of ERbeta1, ERbeta2, and ERbeta5 in PCa. ERbeta2 was commonly found in the cytoplasm and was the most abundant isoform followed by ERbeta1 localized predominantly in the nucleus, and ERbeta5 was primarily located in the cytoplasm. Logistic regression analyses demonstrated that nuclear ERbeta2 (nERbeta2) is an independent prognostic marker for prostate specific antigen (PSA) failure and postoperative metastasis (POM). In a Kaplan-Meier analysis, the combined expression of both nERbeta2 and cytoplasmic ERbeta5 identified a group of patients with the shortest POM-free survival. Cox proportional hazard models revealed that nERbeta2 predicted shorter time to POM. In concordance with IHC data, stable, ectopic expression of ERbeta2 or ERbeta5 enhanced PCa cell invasiveness but only PCa cells expressing ERbeta5 exhibited augmented cell migration. This is the first study to uncover a metastasis-promoting role of ERbeta2 and ERbeta5 in PCa, and show that the two isoforms, singularly and conjointly, have prognostic values for PCa progression. These findings may aid future clinical management of PCa.
Figures
Similar articles
-
The expression of estrogen receptors β2, 5 identifies and is associated with prognosis in non-small cell lung cancer.Endocrine. 2013 Oct;44(2):517-24. doi: 10.1007/s12020-013-9916-z. Epub 2013 Mar 10. Endocrine. 2013. PMID: 23475473
-
Prostate Cancer Expression Profiles of Cytoplasmic ERβ1 and Nuclear ERβ2 are Associated with Poor Outcomes following Radical Prostatectomy.J Urol. 2016 Jun;195(6):1760-6. doi: 10.1016/j.juro.2015.12.101. Epub 2016 Jan 22. J Urol. 2016. PMID: 26804755 Free PMC article.
-
Nuclear and cytoplasmic expression of ERbeta1, ERbeta2, and ERbeta5 identifies distinct prognostic outcome for breast cancer patients.Clin Cancer Res. 2008 Aug 15;14(16):5228-35. doi: 10.1158/1078-0432.CCR-07-4528. Clin Cancer Res. 2008. PMID: 18698041
-
The role of estrogen receptor β in prostate cancer.Mol Med. 2014 Oct 2;20(1):427-34. doi: 10.2119/molmed.2014.00105. Mol Med. 2014. PMID: 25032955 Free PMC article. Review.
-
Divergent features of ERβ isoforms in triple negative breast cancer: progress and implications for further research.Front Cell Dev Biol. 2023 Oct 23;11:1240386. doi: 10.3389/fcell.2023.1240386. eCollection 2023. Front Cell Dev Biol. 2023. PMID: 37936981 Free PMC article. Review.
Cited by
-
Differential expression patterns of estrogen receptor (ER)-β splice variants between papillary thyroid cancer and nodular thyroid goiter.Med Sci Monit. 2012 Sep;18(9):BR351-5. doi: 10.12659/msm.883344. Med Sci Monit. 2012. PMID: 22936184 Free PMC article.
-
Estrogen receptors α and β and aromatase as independent predictors for prostate cancer outcome.Sci Rep. 2016 Sep 9;6:33114. doi: 10.1038/srep33114. Sci Rep. 2016. PMID: 27610593 Free PMC article. Clinical Trial.
-
Estrogen-initiated transformation of prostate epithelium derived from normal human prostate stem-progenitor cells.Endocrinology. 2011 Jun;152(6):2150-63. doi: 10.1210/en.2010-1377. Epub 2011 Mar 22. Endocrinology. 2011. PMID: 21427218 Free PMC article.
-
Trends in estrogen and progesterone receptors in prostate cancer: a bibliometric analysis.Front Oncol. 2023 Jun 9;13:1111296. doi: 10.3389/fonc.2023.1111296. eCollection 2023. Front Oncol. 2023. PMID: 37361598 Free PMC article.
-
Actions of estrogens and endocrine disrupting chemicals on human prostate stem/progenitor cells and prostate cancer risk.Mol Cell Endocrinol. 2012 May 6;354(1-2):63-73. doi: 10.1016/j.mce.2011.08.032. Epub 2011 Sep 5. Mol Cell Endocrinol. 2012. PMID: 21914459 Free PMC article. Review.
References
-
- Adams JY, Leav I, Lau KM, Ho SM, Pflueger SM. Expression of estrogen receptor beta in the fetal, neonatal, and prepubertal human prostate. Prostate. 2002;52:69–81. - PubMed
-
- Allred DC, Clark GM, Elledge R, Fuqua SA, Brown RW, Chamness GC, Osborne CK, McGuire WL. Association of p53 protein expression with tumor cell proliferation rate and clinical outcome in node-negative breast cancer. Journal of the National Cancer Institute. 1993;85:200–206. - PubMed
-
- Cammarata PR, Flynn J, Gottipati S, Chu S, Dimitrijevich S, Younes M, Skliris G, Murphy LC. Differential expression and comparative subcellular localization of estrogen receptor beta isoforms in virally transformed and normal cultured human lens epithelial cells. Experimental Eye Research. 2005;81:165–175. - PubMed
-
- Chen JQ, Delannoy M, Cooke C, Yager JD. Mitochondrial localization of ERalpha and ERbeta in human MCF7 cells. American Journal of Physiology. Endocrinology and Metabolism. 2004;286:E1011–E1022. - PubMed
Publication types
MeSH terms
Substances
Grants and funding
LinkOut - more resources
Full Text Sources
Medical
Research Materials
Miscellaneous
