. 2010 Jul 23;285(30):23466-76.
doi: 10.1074/jbc.M109.093500. Epub 2010 May 25.

Canonical transient receptor potential 6 (TRPC6), a redox-regulated cation channel

Affiliations

Canonical transient receptor potential 6 (TRPC6), a redox-regulated cation channel

Sarabeth Graham et al. J Biol Chem. .

Abstract

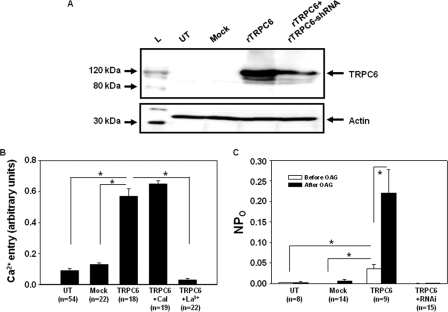
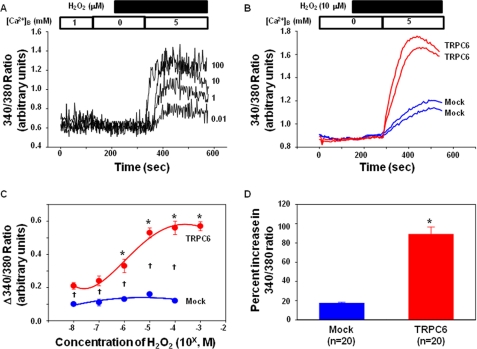
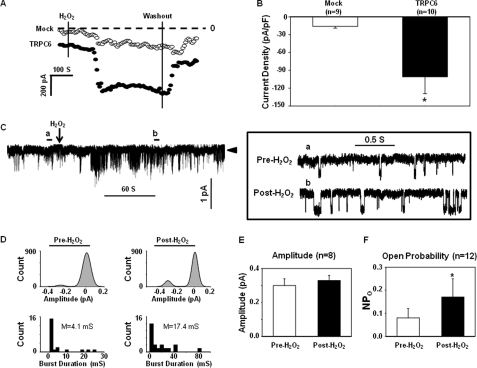
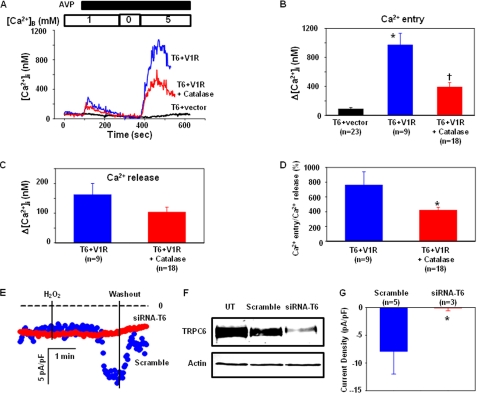
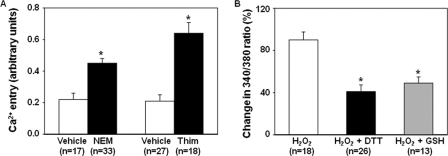
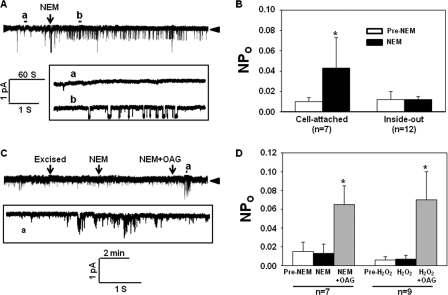
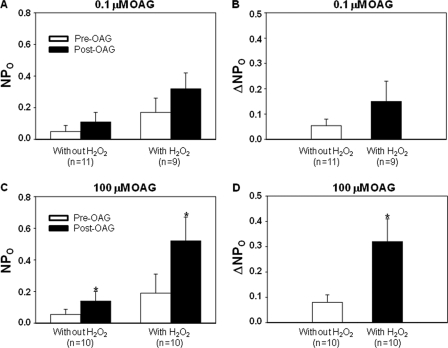
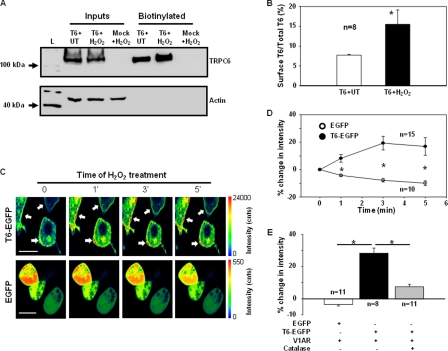
This study examined the effect of H(2)O(2) on the TRPC6 channel and its underlying mechanisms using a TRPC6 heterologous expression system. In TRPC6-expressing HEK293T cells, H(2)O(2) significantly stimulated Ca(2+) entry in a dose-dependent manner. Electrophysiological experiments showed that H(2)O(2) significantly increased TRPC6 channel open probability and whole-cell currents. H(2)O(2) also evoked a robust inward current in A7r5 vascular smooth muscle cells, which was nearly abolished by knockdown of TRPC6 using a small interfering RNA. Catalase substantially attenuated arginine vasopressin (AVP)-induced Ca(2+) entry in cells co-transfected with TRPC6 and AVP V1 receptor. N-Ethylmaleimide and thimerosal were able to simulate the H(2)O(2) response. Dithiothreitol or glutathione-reduced ethyl ester significantly antagonized the response. Furthermore, both N-ethylmaleimide- and H(2)O(2)-induced TRPC6 activations were only observed in the cell-attached patches but not in the inside-out patches. Moreover, 1-oleoyl-2-acetyl-sn-glycerol effect on TRPC6 was significantly greater in the presence of H(2)O(2). Biotinylation assays revealed a significant increase in cell surface TRPC6 in response to H(2)O(2). Similarly, in cells transfected with TRPC6-EGFP, confocal microscopy showed a significant increase in fluorescence intensity in the region of the cell membrane and adjacent to the membrane. AVP also increased the fluorescence intensity on the surface of the cells co-transfected with TRPC6-EGFP and V1 receptor, and this response was inhibited by catalase. These data indicate that H(2)O(2) activates TRPC6 channels via modification of thiol groups of intracellular proteins. This cysteine oxidation-dependent pathway not only stimulates the TRPC6 channel by itself but also sensitizes the channels to diacylglycerol and promotes TRPC6 trafficking to the cell surface.


Figures

FIGURE 1.
FIGURE 1.
TRPC6 channel response in TRPC6-expressing HEK293T cells. A, Western blot, showing the expression level of TRPC6 protein in untransfected (UT) HEK293T cells and the HEK293T cells with transient transfection of vector (Mock), rat TRPC6 expression plasmid (rTRPC6), and rTRPC6 plus RNAi constructs for rat TRPC6 (rTRPC6+rTRPC6-shRNA). TRPC6 was probed with rabbit anti-TRPC6 antibody. L, ladder of a protein marker. Actin was used as a loading control. B, fura-2 fluorescence measurement of Ca2+ entry response stimulated by 100 μm OAG in untransfected (UT), vector-transfected (Mock), and TRPC6-expressing (TRPC6) cells, and TRPC6-expressing cells treated with 1 μm calphostin C (TRPC6+Cal) or 2 μm La3+ (TRPC6+La3+). C, cell-attached patch clamp, showing channel open probability (NPo) in response to 100 μm OAG in untransfected (UT), vector-transfected (Mock), TRPC6 expression plasmid (TRPC6)-transfected, and TRPC6 expression plasmid plus its RNAi construct-transfected (TRPC6+RNAi) HEK293T cells. B and C, *, p < 0.05, between the groups as indicated. n indicates the number of cells analyzed from at least six different transfections.
FIGURE 2.
FIGURE 2.
Effect of H2O2 on the intracellular Ca2+ signal in TRPC6-expressing and empty vector-transfected HEK293T cells. A, representative traces, showing the changes in intracellular Ca2+ level upon 5 mm Ca2+ readdition to a Ca2+ free bathing solution in cells treated with different concentrations of H2O2. The Ca2+ concentration in the bathing solution is indicated by the numbers inside the top open bar. Application of H2O2 is indicated by the top solid bar. [Ca2+]B indicates the Ca2+ concentration in the bathing solution. The numbers next to each trace indicate the concentration of H2O2m) applied. B, representative traces, displaying intracellular Ca2+ response to Ca2+ readdition in vector-transfected (Mock) and rTRPC6-transfected (TRPC6) cells in the presence of 10 μm H2O2. The Ca2+ concentration in the bathing solution is indicated by the numbers inside the top open bar. Application of H2O2 is indicated by the top solid bar. [Ca2+]B indicates the Ca2+ concentration in the bathing solution. C, summary data from five sets of TRPC6-transfected cells and two sets of empty vector-transfected cells, showing a dose-dependent response of Ca2+ entry on H2O2 treatments in TRPC6-expressing but not in vector-transfected cells. Δ340:380 ratio indicates the difference in the values before addition and the peak values after addition of 5 mm Ca2+ solution, representing the Ca2+ entry response. The numbers of cells in each group are from 16 to 25. *, p < 0.05, compared with 10−8 m in TRPC6-transfected cells; †, p < 0.05, comparison between TRPC6-transfected and Mock-transfected cells at corresponding doses. D, percent increases in the ratios of 340:380 in response to 10 μm H2O2 in Mock- and TRPC6-transfected cells. n indicates the number of cells analyzed. *, p < 0.05, TRPC6 versus Mock.
FIGURE 3.
FIGURE 3.
Effect of H2O2 on whole-cell currents (A and B, whole-cell patch) and single channel currents (C–F, cell-attached patch) in TRPC6-expressing HEK293T cells. A, representative whole-cell current measurements obtained by a Gap-free protocol in a Mock (open circles)- and a TRPC6-transfected (solid circles) cell at a holding potential of −60 mV. The dashed lines indicate zero currents. Application and removal of H2O2 are indicated by the vertical lines. B, summary data, showing the H2O2 effect on the whole-cell currents in the Mock control and TRPC6-expressing cells. The responses were measured by the difference between the membrane current before application of H2O2 and the peak current after application of H2O2. The whole-cell currents are expressed as current density (pA/pF), normalized to the cell membrane capacitance. n indicates the number of cells analyzed. Asterisk indicates statistically significant difference compared with Mock (Student's t test). C, representative traces of single channel currents in a cell-attached patch. Left panel, a real time continuous recording. The arrowhead indicates the closed state of the channels. Downward deflections indicate inward currents. Right panel, the time-expanded portions of the selected regions in the upper trace, indicated by a (Pre-H2O2) and b (Post-H2O2). D, amplitude histograms (upper panels) and open time distributions (bottom panels) of the currents before (left panels) and after (right panels) application of H2O2 in the traces shown in C. The amplitude histograms were fitted to Gaussian function. M in the bottom panels indicates mean open time. E, single channel amplitudes before and after application of 10 μm H2O2. n indicates the number of cells analyzed. F, effect of H2O2 on the NPo of TRPC6 channels in 12 cells. *, p < 0.05, compared with pre-H2O2 (paired Student's t test). The cells in each group of B, E, and F were from at least four sets of transfection.
FIGURE 4.
FIGURE 4.
A–D, Ca2+ imaging experiments, showing involvement of endogenous H2O2 in AVP-stimulated Ca2+ entry. A, representative traces, showing the AVP-evoked Ca2+ response in HEK293T cells expressing TRPC6 and an empty vector (T6+vector) or in cells co-transfected with TRPC6 and AVP V1R in the presence (T6+V1R+Catalase) or absence (T6+V1R) of PEG-catalase (250 units/ml for 30 min). Ca2+ concentration in the bathing solution is indicated by the numbers inside the top open bar. Application of 100 nm AVP is indicated by the top solid bar. [Ca2+]B indicates the Ca2+ concentration in the bathing solution. B, summary data, showing Ca2+ entry responses in different groups. *, p < 0.05, compared with T6 + vector; †, p < 0.05, compared with T6 + vector and T6 + V1R. C, effect of catalase on AVP-induced Ca2+ release in cells co-transfected with TRPC6 and AVP V1R. D, effect of catalase on normalized Ca2+ entry (ratio of Ca2+ entry to Ca2+ release) in response to AVP stimulation. *, p < 0.05, compared with T6 + V1R. B–D, n indicates the number of cells analyzed from 4 to 5 sets of transfection. E–G, in A7r5 cells. E, whole-cell patch clamp, showing inward currents in response to 100 μm H2O2 in A7r5 with (siRNA-T6) and without (Scramble) knockdown of TRPC6 at a holding potential of −60 mV. The dashed lines indicate zero currents. Application and removal of H2O2 were indicated by the vertical lines. F, Western blot, showing TRPC6 expression levels in A7r5 cells transfected with TRPC6 siRNA sequence (siRNA-T6) and scrambled sequence (Scramble). Actin served as a loading control. UT, untransfected. G, summary data, showing the H2O2 effect on whole-cell currents in A7r5 cells with (SiRNA-T6) and without (Scramble) knockdown of TRPC6. The responses were measured by the difference between the membrane current before application of H2O2 and the peak current after application of H2O2. The whole-cell currents were expressed as current density (pA/pF), normalized to the cell membrane capacitance. n indicates the number of cells analyzed from three sets of transfection. Asterisk indicates statistically significant difference compared with Scramble (Student's t test).
FIGURE 5.
FIGURE 5.
Effect of thiol group oxidation and reduction on TRPC6-mediated Ca2+ response. A, Ca2+ entry response in TRPC6-expressing cells with treatments of NEM (300 μm) and thimerosal (Thim, 100 μm), and their vehicles (DMSO for NEM and H2O for thimerosal). *, p < 0.05, compared with corresponding vehicle. n indicates the number of cells analyzed. B, percent increases in the intracellular Ca2+ levels upon Ca2+ readdition in TRPC6-expressing cells with the treatments of H2O2 (10 μm), H2O2 plus DTT (1 mm), or H2O2 plus GSH-MEE (1 mm). DTT was applied ∼2 min prior to H2O2 application. *, p < 0.05, compared with H2O2 group. n indicates the number of cells analyzed. Each group in A and B represents the cells from 5 to 6 sets of transfection.
FIGURE 6.
FIGURE 6.
Patch clamp experiments, analyzing the sites of thiol groups involved in TRPC6 channel activation. All experiments were carried out in TRPC6-expressing HEK293T cells. A, representative traces of single channel recordings in a cell-attached patch. Upper panel, a real time continuous recording. Arrowhead, the closed state of channels. Bottom panel, the time-expanded portions of the selected regions in the upper trace. B, summary data, showing the effect of NEM (300 μm) on NPo of TRPC6 channels in the cell-attached and inside-out mode of patch clamp recordings. *, p < 0.05, compared with pre-NEM (paired Student's t test). n indicates the number of analyzed cells with four to five sets of transfection. C, representative traces in an inside-out patch recording, showing the channel activity before and after application of NEM and NEM+OAG. Arrowhead, the closed state of channels. The bottom trace is a time-expanded portion of the region in the upper trace, as indicated. D, summary data, showing the effect of NEM, H2O2, and OAG on TRPC6 channel activity in the inside-out patch clamp mode. Asterisk indicates p < 0.05, compared with other groups (one-way repeated measures analysis of variance). n indicates the number of analyzed cells with four sets of transfection.
FIGURE 7.
FIGURE 7.
Cell-attached patch clamp, showing the OAG effect on channel activity in TRPC6 expressing HEK293T cells with and without pretreatment with H2O2 (10 μm for 3 min). A and B, cells were stimulated with 0.1 μm OAG. C and D, cells were stimulated with 100 μm OAG. A and C indicate the channel activity (NPo) before and after OAG treatment in the presence and absence of H2O2. B and D show the difference in OAG-induced increase in channel activity (ΔNPo) with and without existence of H2O2. n indicates the number of cells analyzed, and each group represents at least four sets of transfection. *, p < 0.05, versus pre-OAG in C, and versusWithout H2O2” in D.
FIGURE 8.
FIGURE 8.
Analysis of TRPC6 trafficking to the cell surface in response to H2O2. A, biotinylation of TRPC6 protein in HEK293T cells transfected with TRPC6 (T6) or empty vector (Mock) with and without H2O2 stimulation. L, a protein ladder; T6+UT, TRPC6-expressing cells without H2O2 treatment; T6+H2O2, TRPC6-expressing cells treated with 10 μm H2O2 for 3 min; Mock+H2O2, empty vector-transfected cells treated with 10 μm H2O2 for 3 min; Inputs, the whole-cell lysates (unbiotinylated), ∼1:10 of the lysates used for biotinylation. B, quantitative analysis of the cell surface TRPC6 protein with and without H2O2 stimulation. Data were expressed as percentages of integrated optical density of TRPC6 immunoblots in biotinylated fractions to the corresponding inputs, calculated by (integrated optical density of biotinylated TRPC6 blot/(integrated optical density of TRPC6 blot in input × 10)) × 100. n indicates the number of independent experiments. The optical density of immunoblots was measured with a software provided by AlphaEaseFC Imaging System (Alpha Innotech). Asterisk indicates significant difference compared with T6+UT. C, representative confocal microscopy photographs, showing TRPC6 trafficking to the region of the plasma membrane in response to 10 μm H2O2 stimulation in the cells transfected with TRPC6-EGFP (T6-EGFP), but not in the cells transfected with EGFP alone. Images were consecutively captured before application, immediately, 2, and 4 min after application of H2O2 (labeled with 0, 1′, 3′, and 5′, respectively). The duration of scanning one image was ∼1 min. The rainbow bars on the right indicates the fluorescence intensity in arbitrary units. Arrows indicate the sites of an increase in fluorescence intensity compared with before application of H2O2 (time 0). The horizontal bars in the left panels represent 20 μm. D, time course changes in fluorescence intensity on the cell surface in response to H2O2 in TRPC6-EGFP (T6-EGFP) or EGFP alone (EGFP) transfected cells. Data were expressed as percent changes from the values before application of H2O2 (time 0). The fluorescence intensity was measured using the software SymPhoTime (version 5.0). Asterisk indicates significant difference between T6-EGFP and EGFP at the corresponding time point. n indicates the number of analyzed cells from four sets of transfection. E, percent changes in fluorescence intensity on the cell surface 3 min after application of AVP (100 nm) in HEK293 cells cotransfected with EGFP or TRPC6-EGFP (T6-EGFP) and V1R with and without pretreatment of PEG-catalase (250 units/ml for 30 min). See D for the approach for data analysis. Asterisk indicates significant difference between the indicated groups. n indicates the number of analyzed cells from four sets of transfection.

Similar articles

Cited by

References

    1. Lassègue B., Griendling K. K. (2004) Am. J. Hypertens. 17, 852–860 - PubMed
    1. Rhee S. G., Chang T. S., Bae Y. S., Lee S. R., Kang S. W. (2003) J. Am. Soc. Nephrol. 14, S211–S215 - PubMed
    1. Gianni D., Bohl B., Courtneidge S. A., Bokoch G. M. (2008) Mol. Biol. Cell 19, 2984–2994 - PMC - PubMed
    1. Hidalgo C., Donoso P. (2008) Antioxid. Redox. Signal. 10, 1275–1312 - PubMed
    1. Schnackenberg C. G. (2002) Curr. Opin. Pharmacol. 2, 121–125 - PubMed

Publication types

LinkOut - more resources