Antagonistic anti-urokinase plasminogen activator receptor (uPAR) antibodies significantly inhibit uPAR-mediated cellular signaling and migration
- PMID: 20501655
- PMCID: PMC2930687
- DOI: 10.1074/jbc.M109.077677
Antagonistic anti-urokinase plasminogen activator receptor (uPAR) antibodies significantly inhibit uPAR-mediated cellular signaling and migration
Abstract
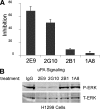
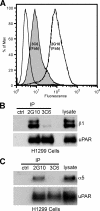
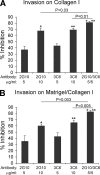
Interactions between urokinase plasminogen activator receptor (uPAR) and its various ligands regulate tumor growth, invasion, and metastasis. Antibodies that bind specific uPAR epitopes may disrupt these interactions, thereby inhibiting these processes. Using a highly diverse and naïve human fragment of the antigen binding (Fab) phage display library, we identified 12 unique human Fabs that bind uPAR. Two of these antibodies compete against urokinase plasminogen activator (uPA) for uPAR binding, whereas a third competes with beta1 integrins for uPAR binding. These competitive antibodies inhibit uPAR-dependent cell signaling and invasion in the non-small cell lung cancer cell line, H1299. Additionally, the integrin-blocking antibody abrogates uPAR/beta1 integrin-mediated H1299 cell adhesion to fibronectin and vitronectin. This antibody and one of the uPAR/uPA antagonist antibodies shows a significant combined effect in inhibiting cell invasion through Matrigel/Collagen I or Collagen I matrices. Our results indicate that these antagonistic antibodies have potential for the detection and treatment of uPAR-expressing tumors.
Figures



Similar articles
-
A new class of orthosteric uPAR·uPA small-molecule antagonists are allosteric inhibitors of the uPAR·vitronectin interaction.ACS Chem Biol. 2015 Jun 19;10(6):1521-34. doi: 10.1021/cb500832q. Epub 2015 Mar 31. ACS Chem Biol. 2015. PMID: 25671694 Free PMC article.
-
Interleukin-1alpha enhances the aggressive behavior of pancreatic cancer cells by regulating the alpha6beta1-integrin and urokinase plasminogen activator receptor expression.BMC Cell Biol. 2006 Feb 20;7:8. doi: 10.1186/1471-2121-7-8. BMC Cell Biol. 2006. PMID: 16504015 Free PMC article.
-
Signaling through urokinase and urokinase receptor in lung cancer cells requires interactions with beta1 integrins.J Cell Sci. 2008 Nov 15;121(Pt 22):3747-56. doi: 10.1242/jcs.029769. Epub 2008 Oct 21. J Cell Sci. 2008. PMID: 18940913 Free PMC article.
-
uPAR as anti-cancer target: evaluation of biomarker potential, histological localization, and antibody-based therapy.Curr Drug Targets. 2011 Nov;12(12):1744-60. doi: 10.2174/138945011797635902. Curr Drug Targets. 2011. PMID: 21707477 Review.
-
[Mechanism of tumor cell-induced extracellular matrix degradation--inhibition of cell-surface proteolytic activity might have a therapeutic effect on tumor cell invasion and metastasis].Nihon Sanka Fujinka Gakkai Zasshi. 1996 Aug;48(8):623-32. Nihon Sanka Fujinka Gakkai Zasshi. 1996. PMID: 8808830 Review. Japanese.
Cited by
-
Antibody-Drug Conjugates Targeting the Urokinase Receptor (uPAR) as a Possible Treatment of Aggressive Breast Cancer.Antibodies (Basel). 2019 Nov 5;8(4):54. doi: 10.3390/antib8040054. Antibodies (Basel). 2019. PMID: 31694242 Free PMC article.
-
Therapeutic strategies targeting uPAR potentiate anti-PD-1 efficacy in diffuse-type gastric cancer.Sci Adv. 2022 May 27;8(21):eabn3774. doi: 10.1126/sciadv.abn3774. Epub 2022 May 25. Sci Adv. 2022. PMID: 35613265 Free PMC article.
-
Site-Specific Radiofluorination of Biomolecules with 8-[(18)F]-Fluorooctanoic Acid Catalyzed by Lipoic Acid Ligase.ACS Chem Biol. 2016 Jun 17;11(6):1587-94. doi: 10.1021/acschembio.6b00172. Epub 2016 Mar 31. ACS Chem Biol. 2016. PMID: 27008570 Free PMC article.
-
High-throughput optofluidic screening of single B cells identifies novel cross-reactive antibodies as inhibitors of uPAR with antibody-dependent effector functions.MAbs. 2023 Jan-Dec;15(1):2184197. doi: 10.1080/19420862.2023.2184197. MAbs. 2023. PMID: 36859773 Free PMC article.
-
Imaging the urokinase plasminongen activator receptor in preclinical breast cancer models of acquired drug resistance.Theranostics. 2014 Jan 18;4(3):267-79. doi: 10.7150/thno.7323. eCollection 2014. Theranostics. 2014. PMID: 24505235 Free PMC article.
References
-
- Sitrin R. G., Pan P. M., Harper H. A., Todd R. F., 3rd, Harsh D. M., Blackwood R. A. (2000) J. Immunol. 165, 3341–3349 - PubMed
-
- Lakka S. S., Rajagopal R., Rajan M. K., Mohan P. M., Adachi Y., Dinh D. H., Olivero W. C., Gujrati M., Ali-Osman F., Roth J. A., Yung W. K., Kyritsis A. P., Rao J. S. (2001) Clin. Cancer Res. 7, 1087–1093 - PubMed
-
- Holst-Hansen C., Johannessen B., Høyer-Hansen G., Rømer J., Ellis V., Brünner N. (1996) Clin. Exp. Metastasis 14, 297–307 - PubMed
-
- Solberg H., Ploug M., Høyer-Hansen G., Nielsen B. S., Lund L. R. (2001) J. Histochem. Cytochem. 49, 237–246 - PubMed
-
- Schnaper H. W., Barnathan E. S., Mazar A., Maheshwari S., Ellis S., Cortez S. L., Baricos W. H., Kleinman H. K. (1995) J. Cell Physiol. 165, 107–118 - PubMed
Publication types
MeSH terms
Substances
Grants and funding
LinkOut - more resources
Full Text Sources
Other Literature Sources
Miscellaneous

