Methyl-beta-cyclodextrin suppresses hyaluronan synthesis by down-regulation of hyaluronan synthase 2 through inhibition of Akt
- PMID: 20501660
- PMCID: PMC2906282
- DOI: 10.1074/jbc.M109.088435
Methyl-beta-cyclodextrin suppresses hyaluronan synthesis by down-regulation of hyaluronan synthase 2 through inhibition of Akt
Abstract
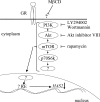
Hyaluronan synthases (HAS1-3) are integral plasma membrane proteins that synthesize hyaluronan, a cell surface and extracellular matrix polysaccharide necessary for many biological processes. It has been shown that HAS is partly localized in cholesterol-rich lipid rafts of MCF-7 cells, and cholesterol depletion with methyl-beta-cyclodextrin (MbetaCD) suppresses hyaluronan secretion in smooth muscle cells. However, the mechanism by which cholesterol depletion inhibits hyaluronan production has remained unknown. We found that cholesterol depletion from MCF-7 cells by MbetaCD inhibits synthesis but does not decrease the molecular mass of hyaluronan, suggesting no major influence on HAS stability in the membrane. The inhibition of hyaluronan synthesis was not due to the availability of HAS substrates UDP-GlcUA and UDP-GlcNAc. Instead, MbetaCD specifically down-regulated the expression of HAS2 but not HAS1 or HAS3. Screening of signaling proteins after MbetaCD treatment revealed that phosphorylation of Akt and its downstream target p70S6 kinase, both members of phosphoinositide 3-kinase-Akt pathway, were inhibited. Inhibitors of this pathway suppressed hyaluronan synthesis and HAS2 expression in MCF-7 cells, suggesting that the reduced hyaluronan synthesis by MbetaCD is due to down-regulation of HAS2, mediated by the phosphoinositide 3-kinase-Akt-mTOR-p70S6K pathway.
Figures


Similar articles
-
Melanoma cell-derived factors stimulate hyaluronan synthesis in dermal fibroblasts by upregulating HAS2 through PDGFR-PI3K-AKT and p38 signaling.Histochem Cell Biol. 2012 Dec;138(6):895-911. doi: 10.1007/s00418-012-1000-x. Epub 2012 Jul 24. Histochem Cell Biol. 2012. PMID: 22825838
-
Cellular content of UDP-N-acetylhexosamines controls hyaluronan synthase 2 expression and correlates with O-linked N-acetylglucosamine modification of transcription factors YY1 and SP1.J Biol Chem. 2011 Sep 23;286(38):33632-40. doi: 10.1074/jbc.M111.265637. Epub 2011 Jul 27. J Biol Chem. 2011. PMID: 21795679 Free PMC article.
-
Methyl-β-cyclodextrin potentiates the BITC-induced anti-cancer effect through modulation of the Akt phosphorylation in human colorectal cancer cells.Biosci Biotechnol Biochem. 2018 Dec;82(12):2158-2167. doi: 10.1080/09168451.2018.1514249. Epub 2018 Sep 10. Biosci Biotechnol Biochem. 2018. PMID: 30200817
-
Metabolic control of hyaluronan synthases.Matrix Biol. 2014 Apr;35:8-13. doi: 10.1016/j.matbio.2013.10.002. Epub 2013 Oct 14. Matrix Biol. 2014. PMID: 24134926 Review.
-
The dynamic metabolism of hyaluronan regulates the cytosolic concentration of UDP-GlcNAc.Matrix Biol. 2014 Apr;35:14-7. doi: 10.1016/j.matbio.2014.01.014. Epub 2014 Jan 30. Matrix Biol. 2014. PMID: 24486448 Free PMC article. Review.
Cited by
-
Antioxidant Systems, lncRNAs, and Tunneling Nanotubes in Cell Death Rescue from Cigarette Smoke Exposure.Cells. 2022 Jul 23;11(15):2277. doi: 10.3390/cells11152277. Cells. 2022. PMID: 35892574 Free PMC article. Review.
-
Bone morphogenic protein (BMP) signaling up-regulates neutral sphingomyelinase 2 to suppress chondrocyte maturation via the Akt protein signaling pathway as a negative feedback mechanism.J Biol Chem. 2014 Mar 21;289(12):8135-50. doi: 10.1074/jbc.M113.509331. Epub 2014 Feb 6. J Biol Chem. 2014. PMID: 24505141 Free PMC article.
-
Neutral sphingomyelinase 2 deficiency increases hyaluronan synthesis by up-regulation of Hyaluronan synthase 2 through decreased ceramide production and activation of Akt.J Biol Chem. 2012 Apr 20;287(17):13620-32. doi: 10.1074/jbc.M111.304857. Epub 2012 Mar 1. J Biol Chem. 2012. PMID: 22383528 Free PMC article.
-
Antioxidant Capacity of Potentilla paradoxa Nutt. and Its Beneficial Effects Related to Anti-Aging in HaCaT and B16F10 Cells.Plants (Basel). 2022 Mar 24;11(7):873. doi: 10.3390/plants11070873. Plants (Basel). 2022. PMID: 35406853 Free PMC article.
-
Hyaluronan synthase assembles hyaluronan on a [GlcNAc(β1,4)]n-GlcNAc(α1→)UDP primer and hyaluronan retains this residual chitin oligomer as a cap at the nonreducing end.Glycobiology. 2017 Jun 1;27(6):536-554. doi: 10.1093/glycob/cwx012. Glycobiology. 2017. PMID: 28138013 Free PMC article.
References
Publication types
MeSH terms
Substances
LinkOut - more resources
Full Text Sources
Miscellaneous

