. 2010 Jun;9(6):1525-35.
doi: 10.1158/1535-7163.MCT-09-1106. Epub 2010 May 25.

Reversible epithelial to mesenchymal transition and acquired resistance to sunitinib in patients with renal cell carcinoma: evidence from a xenograft study

Affiliations

Reversible epithelial to mesenchymal transition and acquired resistance to sunitinib in patients with renal cell carcinoma: evidence from a xenograft study

Hans J Hammers et al. Mol Cancer Ther. 2010 Jun.

Abstract

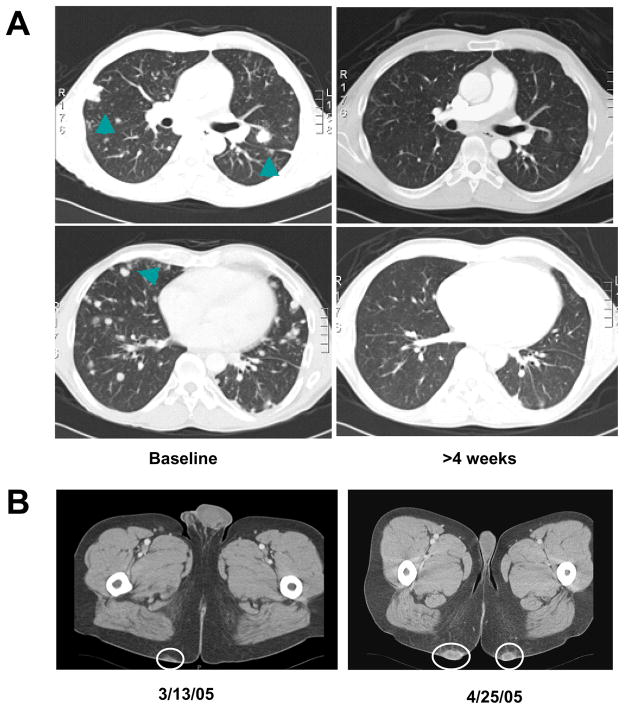
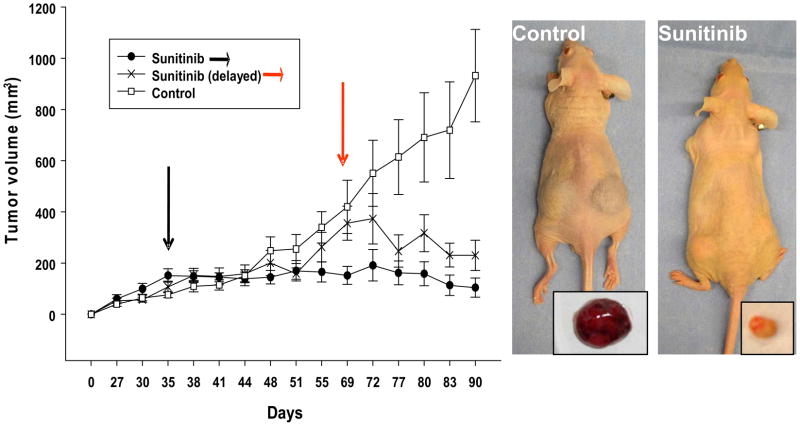
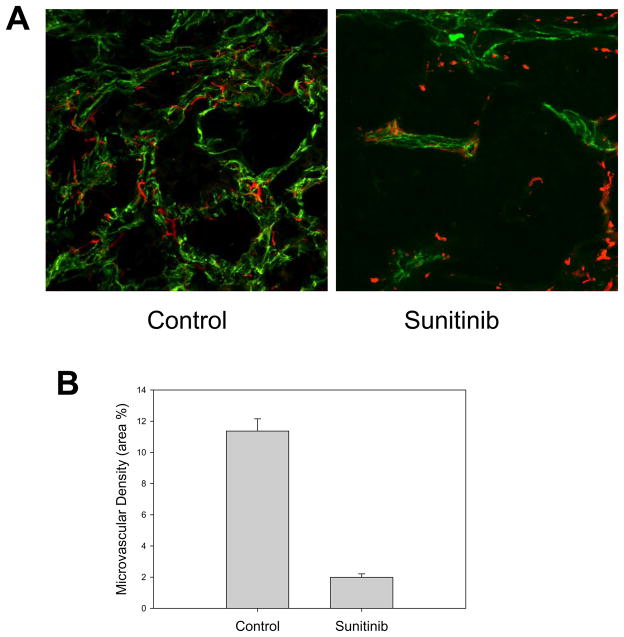
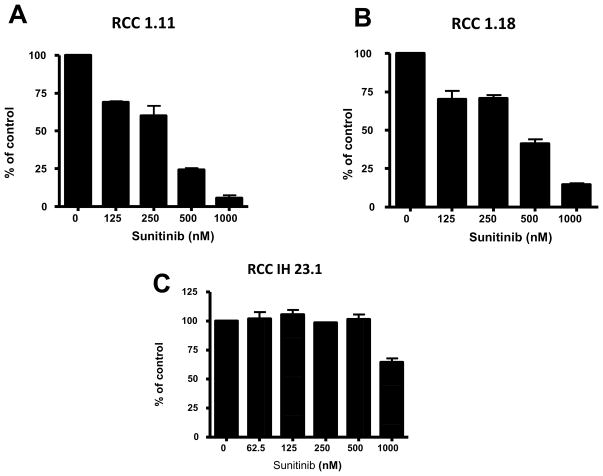
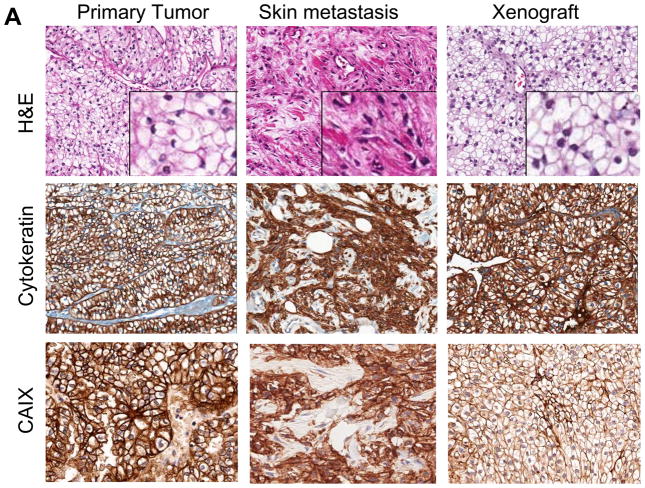
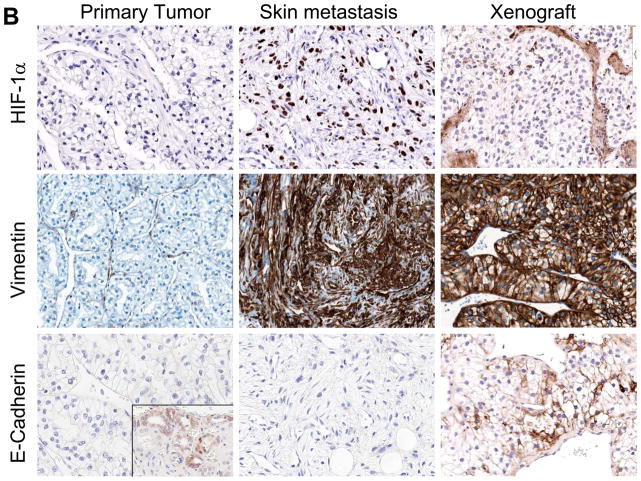
Tyrosine kinase inhibitors (TKI) targeting angiogenesis via inhibition of the vascular endothelial growth factor pathway have changed the medical management of metastatic renal cell carcinoma. Although treatment with TKIs has shown clinical benefit, these drugs will eventually fail patients. The potential mechanisms of resistance to TKIs are poorly understood. To address this question, we obtained an excisional biopsy of a skin metastasis from a patient with clear cell renal carcinoma who initially had a response to sunitinib and eventually progressed with therapy. Tumor pieces were grafted s.c. in athymic nude mice. Established xenografts were treated with sunitinib. Tumor size, microvascular density, and pericyte coverage were determined. Plasma as well as tissue levels for sunitinib were assessed. A tumor-derived cell line was established and assessed in vitro for potential direct antitumor effects of sunitinib. To our surprise, xenografts from the patient who progressed on sunitinib regained sensitivity to the drug. At a dose of 40 mg/kg, sunitinib caused regression of the subcutaneous tumors. Histology showed a marked reduction in microvascular density and pericyte dysfunction. More interestingly, histologic examination of the original skin metastasis revealed evidence of epithelial to mesenchymal transition, whereas the xenografts showed reversion to the clear cell phenotype. In vitro studies showed no inhibitory effect on tumor cell growth at pharmacologically relevant concentrations. In conclusion, the histologic examination in this xenograft study suggests that reversible epithelial to mesenchymal transition may be associated with acquired tumor resistance to TKIs in patients with clear cell renal carcinoma.


Figures

Figure 1
Figure 1. Development of skin metastases during treatment with sunitinib
A) The patient enrolled in the Phase III randomized study received sunitinib with initial regression of lung nodules (arrows) following the first cycle and stable disease for ~10 months; B) During the treatment the patient developed progressive skin metastases that were excised and transplanted in athymic nude mice (circles).
Figure 2
Figure 2. The sunitinib-resistant tumor regained sensitivity to TKIs when transplanted in nude mice
A) Tumor pieces from the original skin metastases were grafted subcutaneously and tumor growth measured by caliper twice a week. Tumor-bearing mice (150–200 mm3) were randomized in three groups: control vehicle and sunitinib early or delayed intervention groups. Treatment started 35 days post implantation for vehicle, sunitinib early intervention group (black arrows) and 66 days post implantation for the sunitinib delayed intervention group (red arrows). The study lasted 90 days with a dosing schedule of 5 days on and 2 days off. Representative pictures show that control tumors were macroscopically much vascularized while sunitinib treated tumors appeared smaller and pale. Results are expressed as mean tumor volume ± SE.
Figure 3
Figure 3. Effect of sunitinib on RCC IH vasculature and microvascular density
A) Treatment with sunitinib resulted in a decreased microvessel density (CD31- green fluorescence staining) associated with signs of pericyte (Desmin – red fluorescence staining) dysfunction. In untreated tumors fine pericyte extension are seen in close proximity to the endothelial cells. In sunitinib treated tumors the fine extensions have disappeared and the pericytes are dissociated from the remaining vasculature. B) Quantitative analysis of microvessel density in control and sunitinib treated tumors. Results are expressed as mean percentage of area occupied by stained cells ± SE.
Figure 4
Figure 4. IH23 tumor cell line derived from the xenograft tumor showed no sensitivity to sunitinib treatment
At pharmacologically relevant doses (up to 500 nM in 10% serum), no direct growth inhibitory effect was seen in a long term exposure assay in the IH23 cell line. Additional RCC 1.11 and RCC 1.18 cell lines showed mild to moderate growth inhibition. Results are expressed as median percentage of control crystal violet positive cells ± SE.
Figure 5
Figure 5. Evidence of epithelial mesenchymal transition (EMT) in sunitinib resistant skin metastases and reverted phenotype to clear cell histology in the tumor xenografts
A) The primary renal cell carcinoma showed conventional clear cell histology (H&E,), while the skin metastasis showed extensive fibroblast-like features and lack of clear cell features suggesting EMT. Following transplantation of the skin metastases in athymic nude mice, the EMT phenotype reverted back to classical clear cell histology. Staining for cytokeratin and CAIX confirmed that the cells with fibroblast like appearance are of epithelial origin. B) HIF-1 α was expressed in the skin lesions but not in the original nephrectomy specimen nor in the murine xenograft. Vimentin, a classical marker of EMT, was absent in the patients primary tumor, but was strongly expressed in the skin metastases and maintained in the xenografts. E-cadherin was expressed in the normal kidney (see insert) but not in the primary tumor nor in the skin metastases. Weak expression was observed in the xenografts.
Figure 6
Figure 6. Deregulation of VHL/Hypoxia genes and chromosomal aberrations in clear cell RCC and the skin metastasis from the patient
Gene expression profiles derived from clear cell (CC, n = 11) and the skin metastasis used in this study were compared with gene expression profiles derived from non-diseased kidney tumor tissue (n = 13). A) Inferred chromosomal changes based on expression of the genes mapped to each chromosomal arm (blue boxes indicate chromosomal loss while red chromosomal gain). Like the clear cell RCC cases, the skin metastasis showed loss of 3p and gain of 5q. B) Gene lists that contain genes responsive to perturbations in VHL and Hypoxia signaling were analyzed using PGSEA (see Methods). Like the clear cell RCC cases, the skin metastasis contains the strong hypoxia and VHL inactivation signatures. The resulting summary statistic (t-statistic) for each gene list was plotted; red, a significant number of genes in the list had increased expression in the tumor samples relative to the normal kidney; blue, a significant number of genes in each list had decreased expression. Only the most significant data are displayed (P < 0.005).

References

    1. Rini BI, Campbell SC, Escudier B. Renal cell carcinoma. Lancet. 2009;373(9669):1119–32. - PubMed
    1. Fabian MA, Biggs WH, 3rd, Treiber DK, Atteridge CE, Azimioara MD, Benedetti MG, et al. A small molecule-kinase interaction map for clinical kinase inhibitors. Nat Biotechnol. 2005;23(3):329–36. - PubMed
    1. Stein MN, Flaherty KT. CCR drug updates: Sorafenib and sunitinib in renal cell carcinoma. Clin Cancer Res. 2007;13(13):3765–70. - PubMed
    1. Motzer RJ, Michaelson MD, Redman BG, et al. Activity of SU11248, a multitargeted inhibitor of vascular endothelial growth factor receptor and platelet-derived growth factor receptor, in patients with metastatic renal cell carcinoma. J Clin Oncol. 2006;24(1):16–24. - PubMed
    1. Maxwell PH, Wiesener MS, Chang GW, et al. The tumour suppressor protein VHL targets hypoxia-inducible factors for oxygen-dependent proteolysis. Nature. 1999;399(6733):271–5. - PubMed

Publication types

MeSH terms