

Fibroblast growth factor receptor signaling dramatically accelerates tumorigenesis and enhances oncoprotein translation in the mouse mammary tumor virus-Wnt-1 mouse model of breast cancer
- PMID: 20501844
- PMCID: PMC3005245
- DOI: 10.1158/0008-5472.CAN-09-4404
Fibroblast growth factor receptor signaling dramatically accelerates tumorigenesis and enhances oncoprotein translation in the mouse mammary tumor virus-Wnt-1 mouse model of breast cancer
Abstract
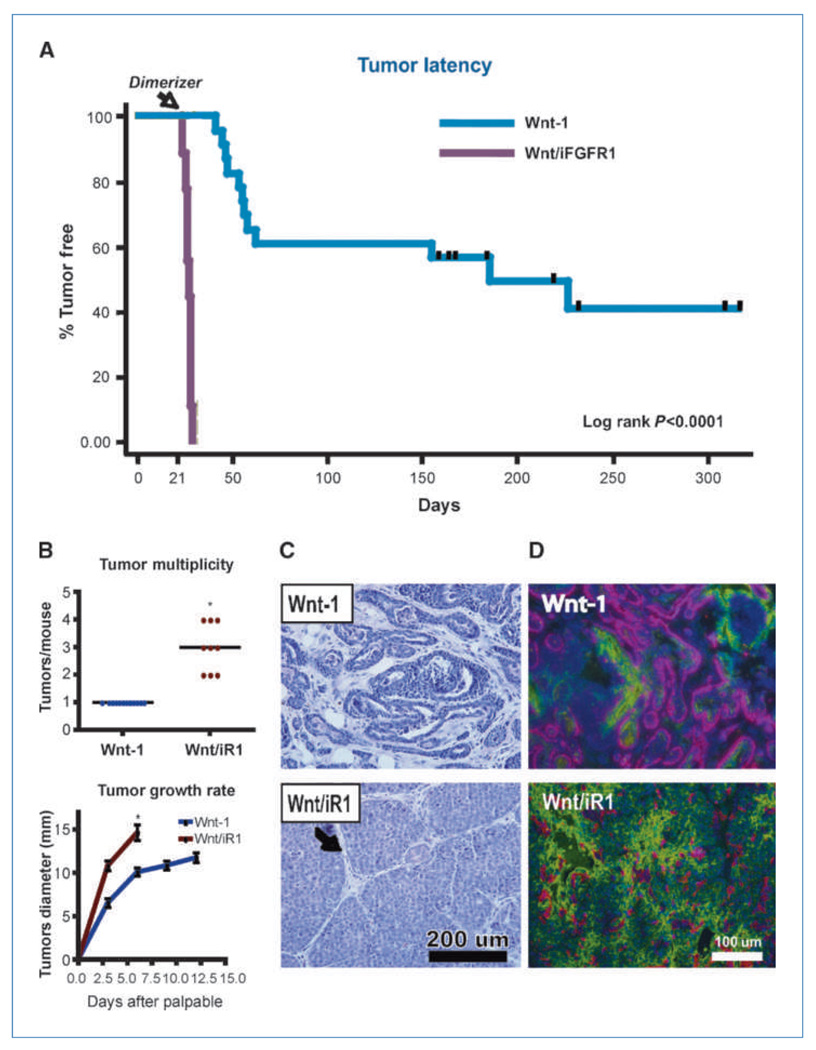
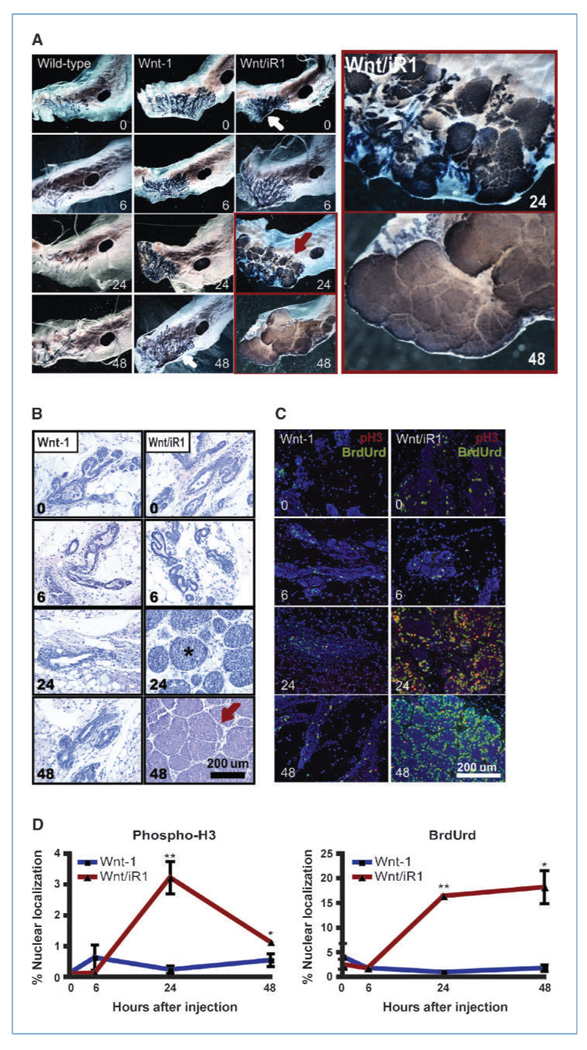
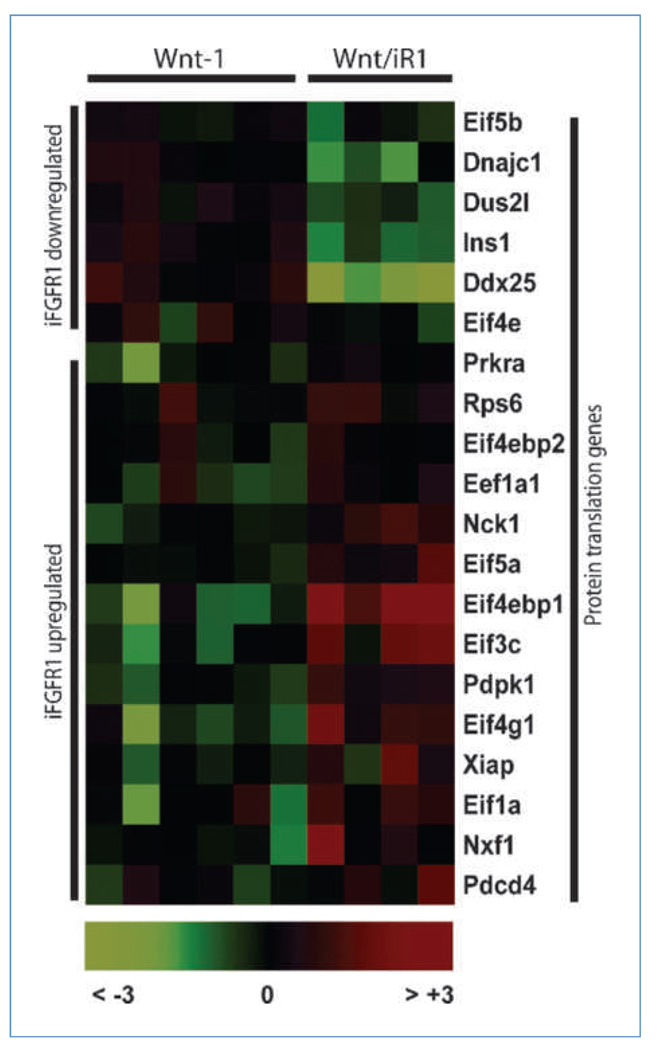
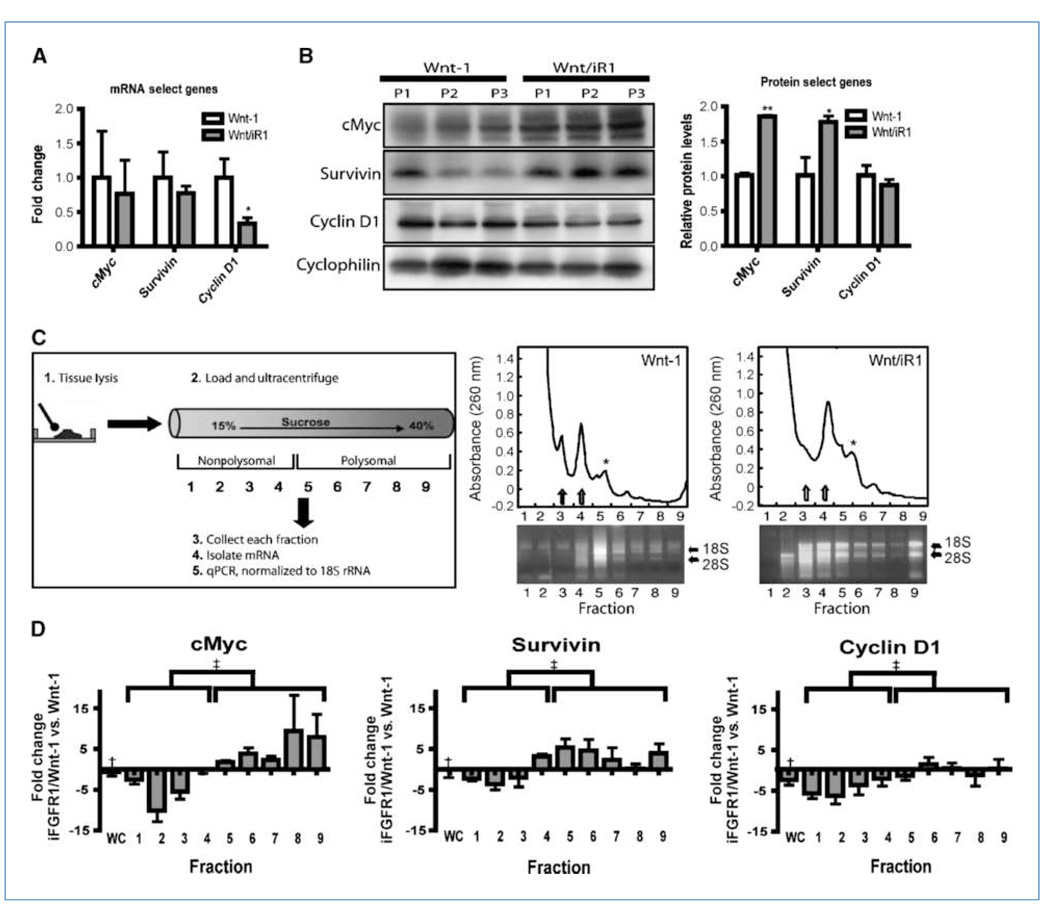
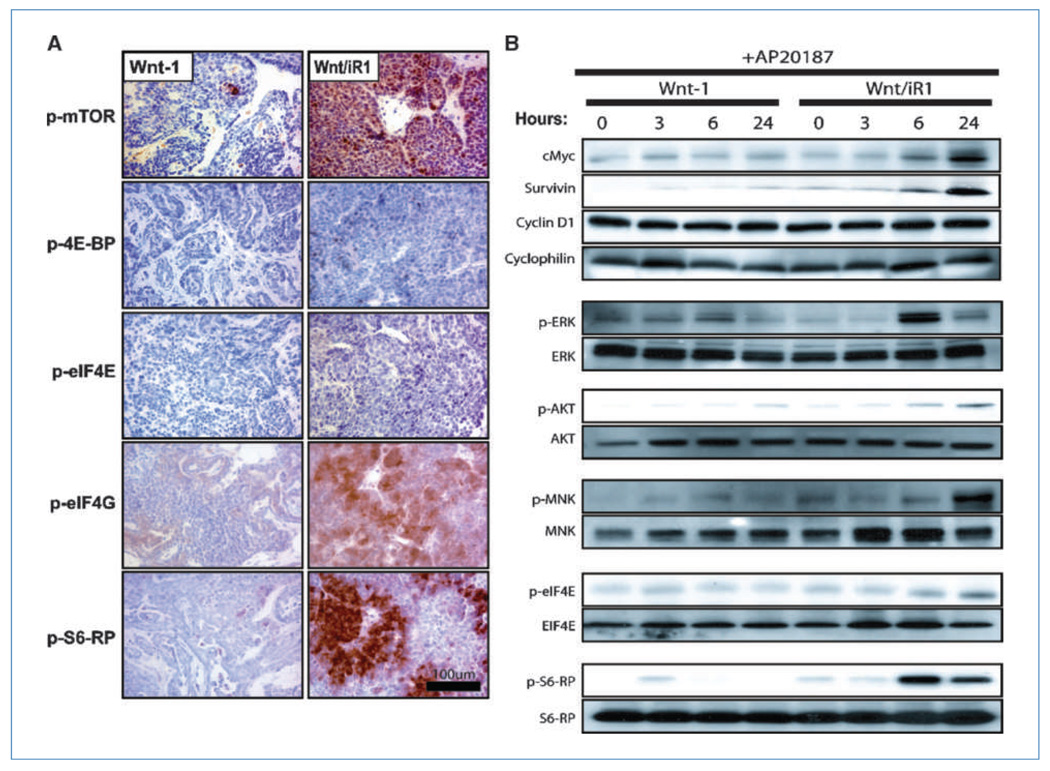
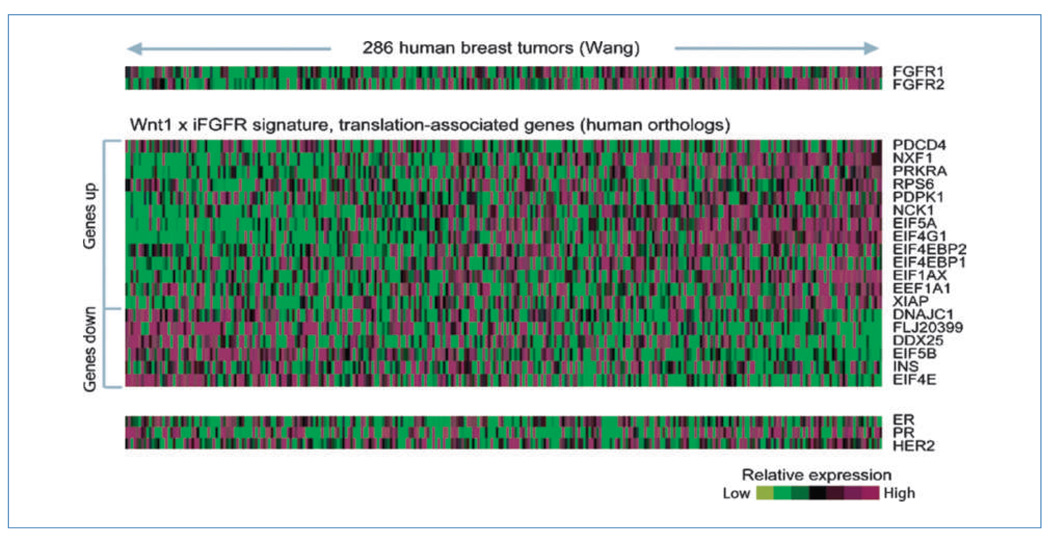
Fibroblast growth factor (FGF) cooperates with the Wnt/beta-catenin pathway to promote mammary tumorigenesis. To investigate the mechanisms involved in FGF/Wnt cooperation, we genetically engineered a model of inducible FGF receptor (iFGFR) signaling in the context of the well-established mouse mammary tumor virus-Wnt-1 transgenic mouse. In the bigenic mice, iFGFR1 activation dramatically enhanced mammary tumorigenesis. Expression microarray analysis did not show transcriptional enhancement of Wnt/beta-catenin target genes but instead showed a translational gene signature that also correlated with elevated FGFR1 and FGFR2 in human breast cancer data sets. Additionally, iFGFR1 activation enhanced recruitment of RNA to polysomes, resulting in a marked increase in protein expression of several different Wnt/beta-catenin target genes. FGF pathway activation stimulated extracellular signal-regulated kinase and the phosphorylation of key translation regulators both in vivo in the mouse model and in vitro in a human breast cancer cell line. Our results suggest that cooperation of the FGF and Wnt pathways in mammary tumorigenesis is based on the activation of protein translational pathways that result in, but are not limited to, increased expression of Wnt/beta-catenin target genes (at the level of protein translation). Further, they reveal protein translation initiation factors as potential therapeutic targets for human breast cancers with alterations in FGF signaling.
Conflict of interest statement
No potential conflicts of interest were disclosed.
Figures
Similar articles
-
Cooperative signaling between Wnt1 and integrin-linked kinase induces accelerated breast tumor development.Breast Cancer Res. 2010;12(3):R38. doi: 10.1186/bcr2592. Epub 2010 Jun 21. Breast Cancer Res. 2010. PMID: 20565980 Free PMC article.
-
Wnt5a suppresses tumor formation and redirects tumor phenotype in MMTV-Wnt1 tumors.PLoS One. 2014 Nov 17;9(11):e113247. doi: 10.1371/journal.pone.0113247. eCollection 2014. PLoS One. 2014. PMID: 25401739 Free PMC article.
-
GPNMB augments Wnt-1 mediated breast tumor initiation and growth by enhancing PI3K/AKT/mTOR pathway signaling and β-catenin activity.Oncogene. 2019 Jun;38(26):5294-5307. doi: 10.1038/s41388-019-0793-7. Epub 2019 Mar 26. Oncogene. 2019. PMID: 30914799
-
A Wnt-ow of opportunity: targeting the Wnt/beta-catenin pathway in breast cancer.Curr Drug Targets. 2010 Sep;11(9):1074-88. doi: 10.2174/138945010792006780. Curr Drug Targets. 2010. PMID: 20545611 Review.
-
Cross-talk of WNT and FGF signaling pathways at GSK3beta to regulate beta-catenin and SNAIL signaling cascades.Cancer Biol Ther. 2006 Sep;5(9):1059-64. doi: 10.4161/cbt.5.9.3151. Epub 2006 Sep 4. Cancer Biol Ther. 2006. PMID: 16940750 Review.
Cited by
-
Transcriptomic classification of genetically engineered mouse models of breast cancer identifies human subtype counterparts.Genome Biol. 2013 Nov 12;14(11):R125. doi: 10.1186/gb-2013-14-11-r125. Genome Biol. 2013. PMID: 24220145 Free PMC article.
-
Challenges and opportunities in the targeting of fibroblast growth factor receptors in breast cancer.Breast Cancer Res. 2012 Jun 19;14(3):208. doi: 10.1186/bcr3139. Breast Cancer Res. 2012. PMID: 22731805 Free PMC article. Review.
-
FGFR1-WNT-TGF-β signaling in prostate cancer mouse models recapitulates human reactive stroma.Cancer Res. 2014 Jan 15;74(2):609-20. doi: 10.1158/0008-5472.CAN-13-1093. Epub 2013 Dec 4. Cancer Res. 2014. PMID: 24305876 Free PMC article.
-
Interplay between estrogen receptor and AKT in estradiol-induced alternative splicing.BMC Med Genomics. 2013 Jun 11;6:21. doi: 10.1186/1755-8794-6-21. BMC Med Genomics. 2013. PMID: 23758675 Free PMC article.
-
TNFAIP3 is required for FGFR1 activation-promoted proliferation and tumorigenesis of premalignant DCIS.COM human mammary epithelial cells.Breast Cancer Res. 2018 Aug 15;20(1):97. doi: 10.1186/s13058-018-1024-9. Breast Cancer Res. 2018. PMID: 30111373 Free PMC article.
References
-
- Grose R, Dickson C. Fibroblast growth factor signaling in tumorigenesis. Cytokine Growth Factor Rev. 2005;16:179–186. - PubMed
-
- Chin K, DeVries S, Fridlyand J, et al. Genomic and transcriptional aberrations linked to breast cancer pathophysiologies. Cancer Cell. 2006;10:529–541. - PubMed
-
- Reis-Filho JS, Simpson PT, Turner NC, et al. FGFR1 emerges as a potential therapeutic target for lobular breast carcinomas. Clin Cancer Res. 2006;12:6652–6662. - PubMed
Publication types
MeSH terms
Substances
Grants and funding
LinkOut - more resources
Full Text Sources
Other Literature Sources
Molecular Biology Databases
Miscellaneous
