. 2010 Jun;120(6):1848-61.
doi: 10.1172/JCI39922. Epub 2010 May 24.

Development of a cross-platform biomarker signature to detect renal transplant tolerance in humans

Affiliations

Development of a cross-platform biomarker signature to detect renal transplant tolerance in humans

Pervinder Sagoo et al. J Clin Invest. 2010 Jun.

Abstract

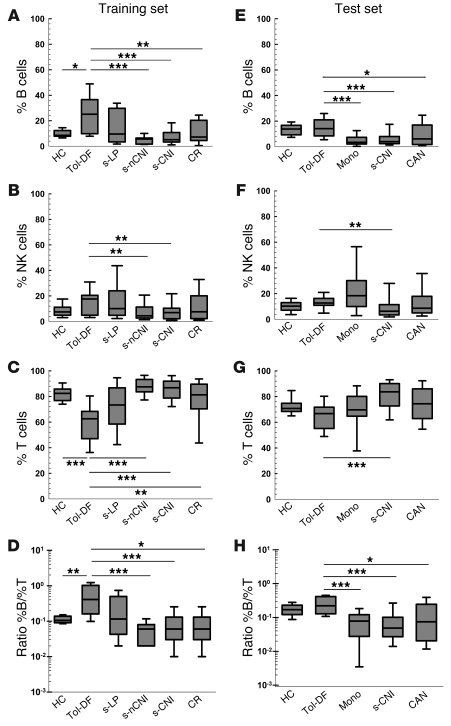
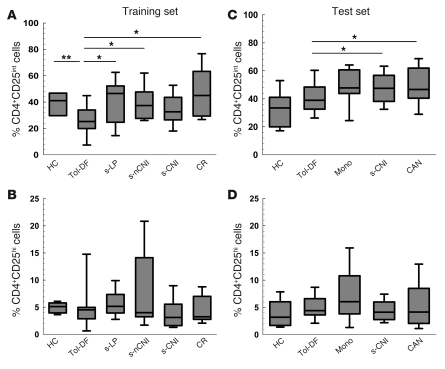
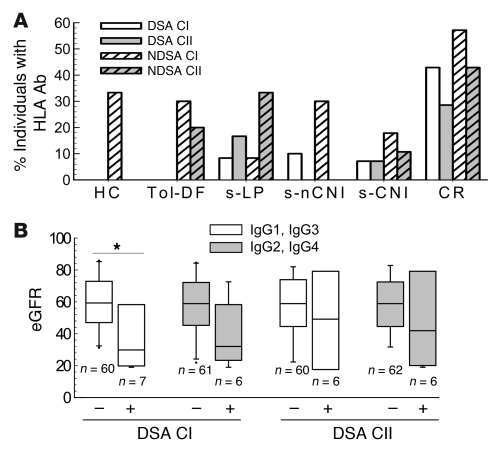
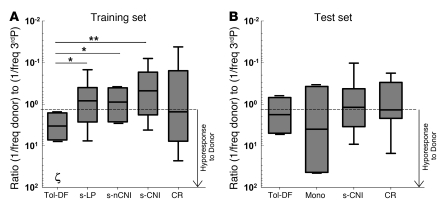
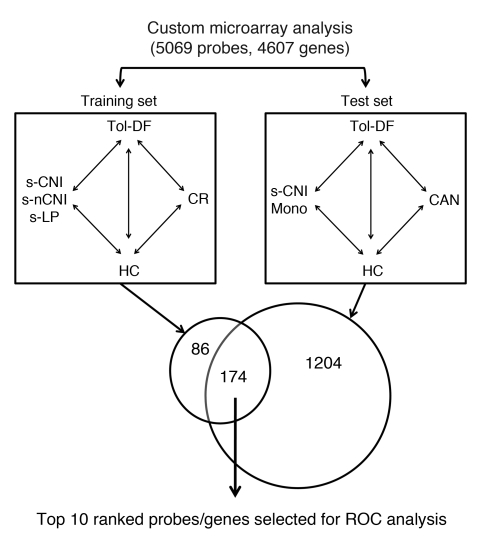
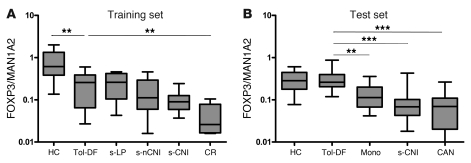
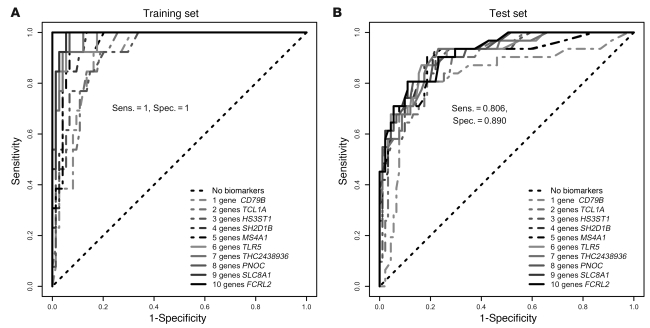
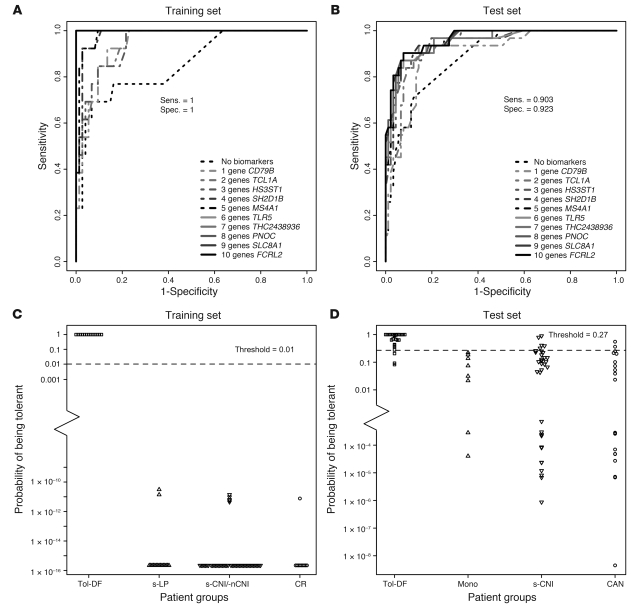
Identifying transplant recipients in whom immunological tolerance is established or is developing would allow an individually tailored approach to their posttransplantation management. In this study, we aimed to develop reliable and reproducible in vitro assays capable of detecting tolerance in renal transplant recipients. Several biomarkers and bioassays were screened on a training set that included 11 operationally tolerant renal transplant recipients, recipient groups following different immunosuppressive regimes, recipients undergoing chronic rejection, and healthy controls. Highly predictive assays were repeated on an independent test set that included 24 tolerant renal transplant recipients. Tolerant patients displayed an expansion of peripheral blood B and NK lymphocytes, fewer activated CD4+ T cells, a lack of donor-specific antibodies, donor-specific hyporesponsiveness of CD4+ T cells, and a high ratio of forkhead box P3 to alpha-1,2-mannosidase gene expression. Microarray analysis further revealed in tolerant recipients a bias toward differential expression of B cell-related genes and their associated molecular pathways. By combining these indices of tolerance as a cross-platform biomarker signature, we were able to identify tolerant recipients in both the training set and the test set. This study provides an immunological profile of the tolerant state that, with further validation, should inform and shape drug-weaning protocols in renal transplant recipients.


Figures

Figure 1
Figure 1. Flow cytometry analysis of peripheral blood lymphocyte subsets of renal transplant recipient groups and HCs.
Flow cytometry analysis of peripheral blood lymphocyte subsets of the training (AD) and test sets (EH). Lymphocyte subsets were defined as follows: B cells as CD19+ lymphocytes (A and E), NK cells as CD56+CD3- lymphocytes (B and F); T cells as CD3+ lymphocytes (C and G). Ratio of CD19+/CD3+ lymphocytes is shown (D and H). Box plots show median and interquartile range. Whiskers above and below the boxes indicate the 5th and 95th percentiles. Two-sided P values for Mann-Whitney U test comparisons between Tol-DF patients and other groups are shown (***P < 0.001, **P < 0.01, *P < 0.05). P values for comparisons between other study groups for the training and test sets are shown in Supplemental Table 1, A and B, respectively.
Figure 2
Figure 2. Flow cytometry analysis of CD4+ T cell expression of CD25 in peripheral blood of renal transplant recipient groups and HCs.
Flow cytometry analysis of CD4+ T cell expression of CD25 of the training (A and B) and test set groups (C and D). Box plots show median and interquartile range. Whiskers above and below the boxes indicate the 5th and 95th percentiles. Percentages of CD4+ T cells with intermediate (CD4+CD25int) and high (CD4+CD25hi) CD25 expression are shown. Two-sided P values for Mann-Whitney U test comparisons between Tol-DF patients and the rest of the groups are shown (**P < 0.01, *P < 0.05). P values for comparisons between other study groups are shown in Supplemental Table 1, A and B.
Figure 3
Figure 3. Serum analysis of donor-specific and nonspecific anti-HLA antibodies, and eGFR.
(A) Percentage of patients per group with positive detection of serum donor–specific (DSA) and nonspecific (NDSA) anti–HLA class I (CI) and class II (CII) antibodies in the training set. (B) Renal function of patients in whom complement-fixing (IgG1, IgG3) or non-complement-fixing (IgG2, IgG4) DSAs were present (+) or absent (–). Box plots show median and interquartile range. Whiskers above and below the boxes indicate the 5th and 95th percentiles. Two-sided P values for Mann-Whitney U test comparisons between groups are shown (*P < 0.05).
Figure 4
Figure 4. Detection of donor-specific hyporesponsiveness in renal transplant study groups by IFN-γ ELISpot analysis.
IFN-γ ELISpots were used to detect direct pathway alloresponses in patients of the (A) training and (B) test sets. The number of IFN-γ–producing cells in recipient CD4+ T cells was calculated (background-deducted) when stimulated with donor cells and third-party cells (3rdP), to obtain a frequency of responder cells (1 responder/n cells). Box plots show median and interquartile range. Whiskers above and below the boxes indicate the 5th and 95th percentiles. Ratio of responder frequencies on donor/3rdP stimulation are shown. Ratio values greater than 1.5 indicate hyporesponsiveness to donor. Two-sided P values for Mann-Whitney U test comparisons between groups are shown (**P < 0.01, *P < 0.05). Individual patient IFN-γ ELISpot responder frequencies to donor and third party are shown in Supplemental Figure 3. ζ, Wilcoxon test between donor and 3rdP frequencies, P < 0.05.
Figure 6
Figure 6. Algorithm for microarray gene expression analysis.
Four-class analysis of microarray gene expression data identified probes significantly differentially expressed between all patient groups of the training and test sets using a Kruskal-Wallis nonparametric test. Probes were ranked within the training set based on their P values with adjustment for 1% FDR. The top 10 ranked probes that overlapped with genes identified in the test set were subsequently used for ROC analysis.
Figure 5
Figure 5. Ratio of FOXP3 to α-1,2-mannosidase (MAN1A2) expression assessed by qRT-PCR gene expression analysis of peripheral blood.
A ratio of the expression values of FOXP3 and MAN1A2 in peripheral blood, determined by qRT-PCR, was calculated for patients of the training set (A) and test set (B). Box plots show median and interquartile range. Whiskers above and below the boxes indicate the 5th and 95th percentiles. Two-sided P values for Mann-Whitney U test comparisons between Tol-DF and other groups are shown (***P < 0.001, **P < 0.01). Statistical values for comparisons between other study groups are shown in Supplemental Table 2, A and B.
Figure 7
Figure 7. ROC curve generation using highest-ranked genes identified by microarray analysis.
ROC curves of the training (A) and test sets (B) generated using up to 10 highest-ranked genes (black lines). Significant differential gene expression was detected by microarray analysis of peripheral blood. Using a binary regression model for classification ROC curves (Tol-DF vs. nontolerant groups, excluding HCs) were generated using the top 10 ranked significant genes identified by 4-class Kruskal-Wallis analysis of microarray data. Genes were ranked within the training set based on their P value with 1% FDR. The same 2-class model was used to assess the diagnostic capabilities of the same genes to detect Tol-DF recipients within the test set. Sens., sensitivity; Spec., specificity.
Figure 8
Figure 8. ROC curve generation combining cross-platform biomarkers.
ROC curves of the training set (A) and test set (B) generated using cross-platform biomarkers and genes identified by microarray analysis. Two-class ROC curves (Tol-DF vs. nontolerant groups, excluding HCs) were generated using 4 biomarkers: B/T lymphocyte ratio, percent CD4+CD25int, ratio of anti-donor/anti-3rdP ELISpot frequencies, and ratio of FOXP3/MAN1A2 expression, combined with sequential addition of the 10 most significant genes. Estimated probabilities of patients from each study group of the training set (C) and test set (D) being classified as tolerant based on the cross-platform biomarker signature of tolerance (4 biomarkers plus 10 genes), calculated using a binary regression procedure.

Comment in

Similar articles

Cited by

References

    1. Christensen LL, Grunnet N, Rudiger N, Moller B, Birkeland SA. Indications of immunological tolerance in kidney transplantation. Tissue Antigens. 1998;51(6):637–644. doi: 10.1111/j.1399-0039.1998.tb03006.x. - DOI - PubMed
    1. Owens ML, Maxwell JG, Goodnight J, Wolcott MW. Discontinuance of immunosuppression in renal transplant patients. Arch Surg. 1975;110(12):1450–1451. - PubMed
    1. Roussey-Kesler G, et al. Clinical operational tolerance after kidney transplantation. Am J Transplant. 2006;6(4):736–746. doi: 10.1111/j.1600-6143.2006.01280.x. - DOI - PubMed
    1. Uehling DT, Hussey JL, Weinstein AB, Wank R, Bach FH. Cessation of immunosuppression after renal transplantation. Surgery. 1976;79(3):278–282. - PubMed
    1. Strober S, Benike C, Krishnaswamy S, Engleman EG, Grumet FC. Clinical transplantation tolerance twelve years after prospective withdrawal of immunosuppressive drugs: studies of chimerism and anti-donor reactivity. Transplantation. 2000;69(8):1549–1554. - PubMed

Publication types