. 2010 Jun;120(6):1862-72.
doi: 10.1172/JCI41789. Epub 2010 May 24.

A molecular classifier for predicting future graft loss in late kidney transplant biopsies

Affiliations

A molecular classifier for predicting future graft loss in late kidney transplant biopsies

Gunilla Einecke et al. J Clin Invest. 2010 Jun.

Abstract

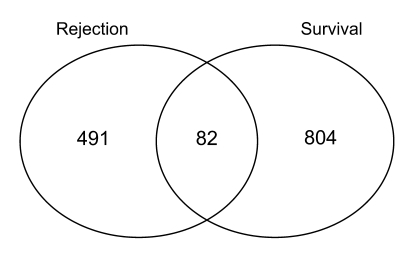
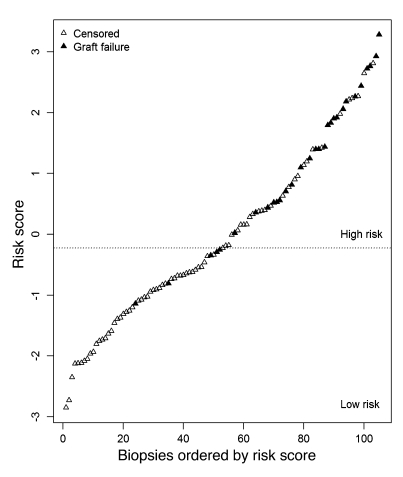
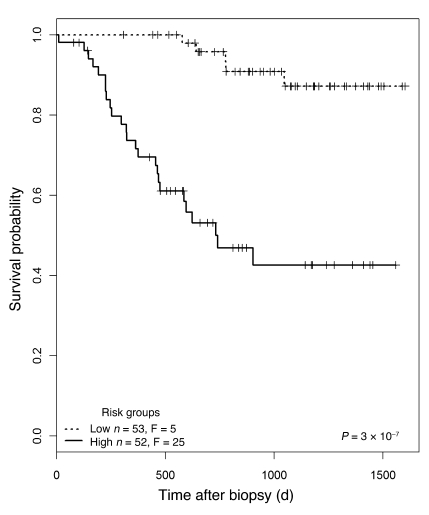
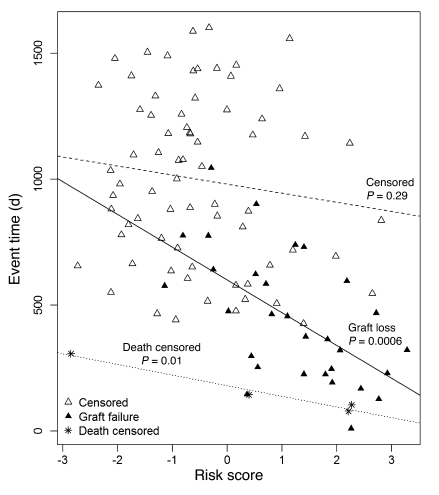
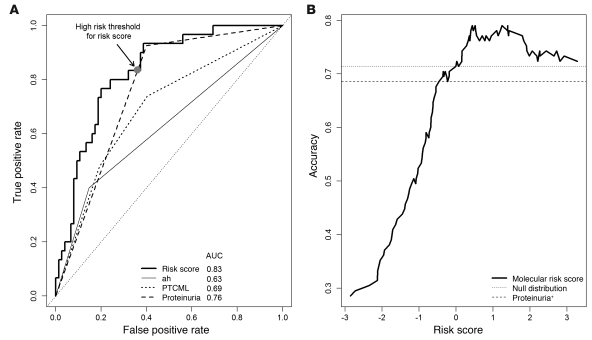
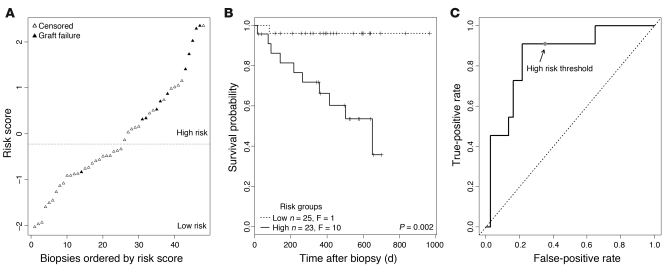
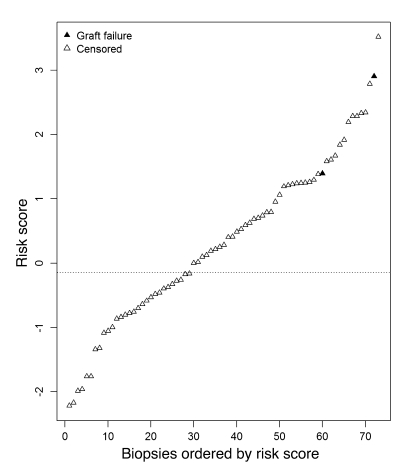
Kidney transplant recipients that develop signs of renal dysfunction or proteinuria one or more years after transplantation are at considerable risk for progression to renal failure. To assess the kidney at this time, a "for-cause" biopsy is performed, but this provides little indication as to which recipients will go on to organ failure. In an attempt to identify molecules that could provide this information, we used microarrays to analyze gene expression in 105 for-cause biopsies taken between 1 and 31 years after transplantation. Using supervised principal components analysis, we derived a molecular classifier to predict graft loss. The genes associated with graft failure were related to tissue injury, epithelial dedifferentiation, matrix remodeling, and TGF-beta effects and showed little overlap with rejection-associated genes. We assigned a prognostic molecular risk score to each patient, identifying those at high or low risk for graft loss. The molecular risk score was correlated with interstitial fibrosis, tubular atrophy, tubulitis, interstitial inflammation, proteinuria, and glomerular filtration rate. In multivariate analysis, molecular risk score, peritubular capillary basement membrane multilayering, arteriolar hyalinosis, and proteinuria were independent predictors of graft loss. In an independent validation set, the molecular risk score was the only predictor of graft loss. Thus, the molecular risk score reflects active injury and is superior to either scarring or function in predicting graft failure.


Figures

Figure 1
Figure 1. Overlap of genes associated with graft loss and those associated with rejection.
We identified the genes associated with graft loss in a Cox regression model (P < 0.0001) and compared them with those genes whose association with rejection versus nonrejection was significant (t test) at P < 0.0001. The number of genes that were unique to each list as well as the number of overlapping genes are shown.
Figure 2
Figure 2. Molecular risk scores in individual biopsies.
We built a molecular classifier based on 105 kidney transplant biopsies taken for clinical indications 1 year or more after transplantation and used the result to assign a molecular risk score to each biopsy. Biopsies were sorted by risk score; each biopsy is represented by 1 triangle. Biopsies from patients with subsequent graft loss are indicated in black. Biopsies were assigned into high- or low-risk groups, with the threshold determined by the median risk score.
Figure 3
Figure 3. Kaplan-Meier plots for the two risk groups.
Biopsies were separated into high- and low-risk groups, as shown in Figure 2. F, failed.
Figure 4
Figure 4. Relationship between risk score and failure/censoring time.
Time to event (graft failure, patient death, or end of follow-up) is plotted against the molecular risk score for each biopsy. Each biopsy is represented by one symbol. Biopsies from patients with subsequent graft loss are represented as black triangles; biopsies from patients who died with a functioning graft are represented by asterisks. All other biopsies are represented by white triangles. Regression lines were drawn separately for patients censored for end of study, those censored for patient death with a functioning graft, and those with graft loss.
Figure 5
Figure 5. ROC curves of molecular risk score compared with clinical and histologic features.
(A) To assess the sensitivity and specificity of the molecular classifier compared with that of clinical features, we compared the ROC curve derived from the molecular risk score with variables significantly associated with graft loss in a multivariate analysis. AUC is indicated for each parameter. (B) Accuracy (total correct predictions/total samples) for varying risk score thresholds for predicting graft failure. The dashed line represents the accuracy when the presence of proteinuria was used as the single threshold for predicting failure. The dotted line is the accuracy when all samples are predicted to survive. ah, arteriolar hyalinosis.
Figure 6
Figure 6. Performance of the classifier in an independent validation set.
Based on the classifier results derived from the 105 biopsies in our dataset, we calculated risk scores for each sample in an independent set of biopsies (n = 48) with similar clinical and histologic features. (A) Risk scores in relation to graft loss in the validation set, showing the risk threshold derived from the main (n = 105) dataset. (B) Kaplan-Meier plots of the 2 risk groups in the validation set, using the threshold shown in Figure 6A. (C) ROC curves illustrating sensitivity/specificity of the risk scores in the validation set.
Figure 7
Figure 7. Molecular risk scores in biopsies taken within 1 year after transplantation.
The molecular risk score has high predictive value in patients at risk of graft loss. To assess whether the associated gene expression changes are unique to the population at risk, we applied the classifier results to a set of biopsies taken within the first year after transplantation.

Comment in

References

    1. Einecke G, et al. Antibody-mediated microcirculation injury is the major cause of late kidney transplant failure. Am J Transplant. 2009;9(11):2520–2531. doi: 10.1111/j.1600-6143.2009.02799.x. - DOI - PubMed
    1. Gaber LW, et al. Correlation between Banff classification, acute renal rejection scores and reversal of rejection. Kidney Int. 1996;49(2):481–487. doi: 10.1038/ki.1996.68. - DOI - PubMed
    1. Colvin RB, et al. Evaluation of pathologic criteria for acute renal allograft rejection: reproducibility, sensitivity, and clinical correlation. J Am Soc Nephrol. 1997;8(12):1930–1941. - PubMed
    1. Haas M, Kraus ES, Samaniego-Picota M, Racusen LC, Ni W, Eustace JA. Acute renal allograft rejection with intimal arteritis: histologic predictors of response to therapy and graft survival. Kidney Int. 2002;61(4):1516–1526. doi: 10.1046/j.1523-1755.2002.00254.x. - DOI - PubMed
    1. Agodoa L, et al. Assessment of structure and function in progressive renal disease. Kidney Int Suppl. 1997;63:S144–S150. - PubMed

Publication types

Substances