. 2010 Jun;120(6):1836-47.
doi: 10.1172/JCI39933. Epub 2010 May 24.

Identification of a B cell signature associated with renal transplant tolerance in humans

Collaborators, Affiliations

Identification of a B cell signature associated with renal transplant tolerance in humans

Kenneth A Newell et al. J Clin Invest. 2010 Jun.

Abstract

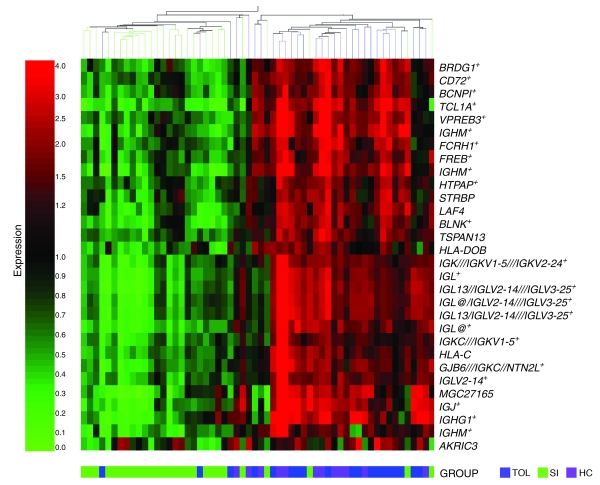
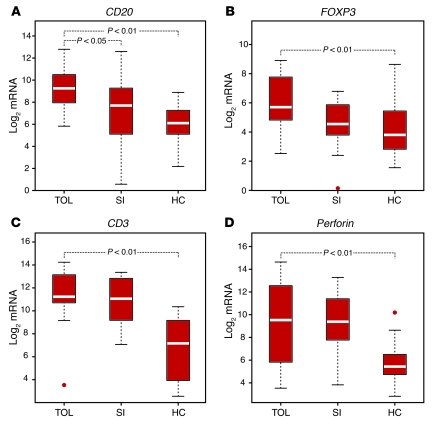
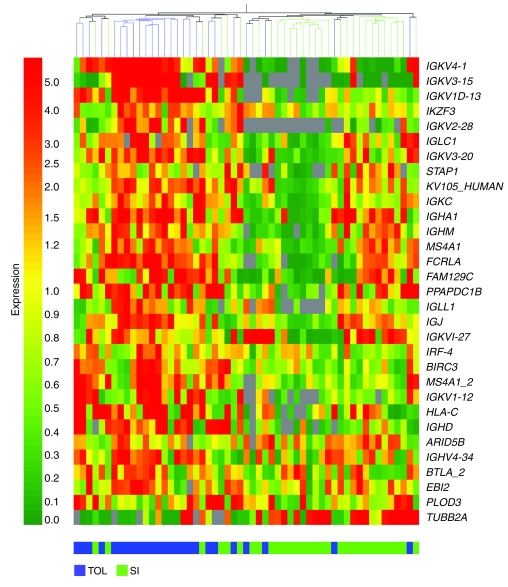
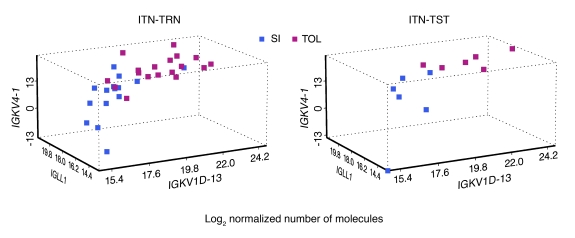
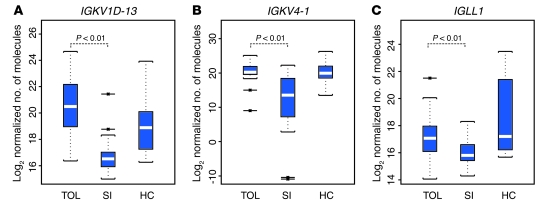
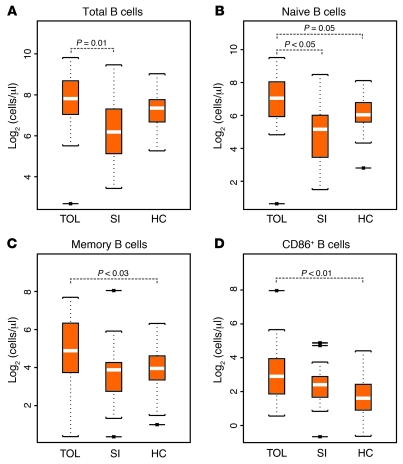
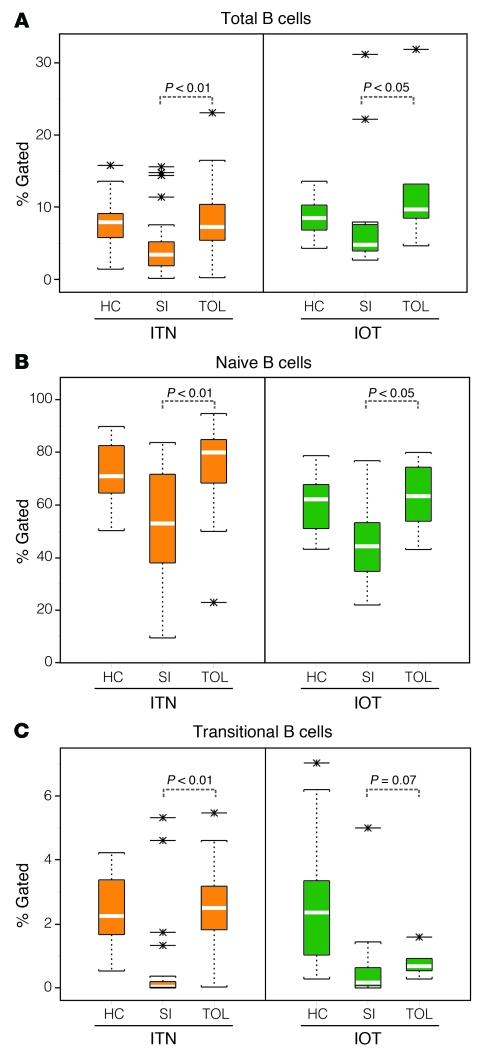
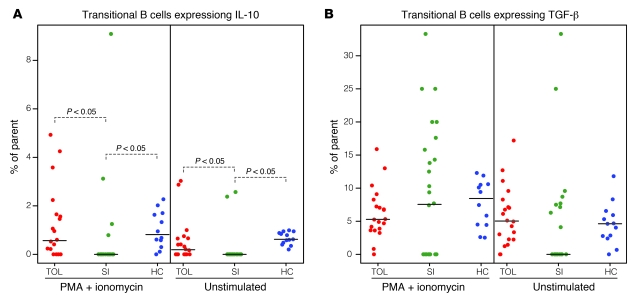
Establishing long-term allograft acceptance without the requirement for continuous immunosuppression, a condition known as allograft tolerance, is a highly desirable therapeutic goal in solid organ transplantation. Determining which recipients would benefit from withdrawal or minimization of immunosuppression would be greatly facilitated by biomarkers predictive of tolerance. In this study, we identified the largest reported cohort to our knowledge of tolerant renal transplant recipients, as defined by stable graft function and receiving no immunosuppression for more than 1 year, and compared their gene expression profiles and peripheral blood lymphocyte subsets with those of subjects with stable graft function who are receiving immunosuppressive drugs as well as healthy controls. In addition to being associated with clinical and phenotypic parameters, renal allograft tolerance was strongly associated with a B cell signature using several assays. Tolerant subjects showed increased expression of multiple B cell differentiation genes, and a set of just 3 of these genes distinguished tolerant from nontolerant recipients in a unique test set of samples. This B cell signature was associated with upregulation of CD20 mRNA in urine sediment cells and elevated numbers of peripheral blood naive and transitional B cells in tolerant participants compared with those receiving immunosuppression. These results point to a critical role for B cells in regulating alloimmunity and provide a candidate set of genes for wider-scale screening of renal transplant recipients.


Figures

Figure 1
Figure 1. TOL participants exhibit unique expression patterns compared with SI participants.
Hierarchical clustering of the 30 genes differentially expressed between TOL versus SI (fold change >2.0 overexpressed in the TOL group). TUBB2A not shown. B cell–specific genes are indicated by asterisks.
Figure 2
Figure 2. Real-time PCR gene expression analyses of urine sedimentary cells.
(A) Higher CD20 expression in TOL than in SI and HC participants. (B) Increased FOXP3 expression in TOL than in HC participants. (C) Higher CD3 expression in TOL than in HC participants. (D) Higher Perforin expression in TOL than in HC participants. Boxes depict IQR; whiskers denote 1.5 × IQR; values beyond this range are considered outliers and shown as circles. P values are shown for statistically significant differences.
Figure 3
Figure 3. Multiplex RT-PCR of peripheral blood identified 31 genes with significantly different numbers of mRNA copies between TOL-TRN and SI-TRN groups.
The transcript relative expression levels are shown on the heat map.
Figure 4
Figure 4. Transcripts that best distinguish TOL from SI.
Multiplex RT-PCR gene expression levels of IGKV1D-13, IGKV4-1, and IGLL1 for the 19 TOL-TRN and 24 SI-TRN samples, and for the 6 TOL-TST and 6 SI-TST samples, in log2 normalized number of molecules.
Figure 5
Figure 5. Box plots of log2 normalized mRNA copy numbers for the 3 genes found to be the best classifiers among the 31 identified as differentially expressed.
(A) IGKV1D-13. (B) IGKV4-1. (C) IGLL1. Genes were derived from LDA, where they were found to have the best predictive value for TOL (Tables 2 and 3). Boxes depict IQR; whiskers denote 1.5 × IQR; values beyond this range are shown as outliers. P values are shown for statistically significant differences.
Figure 6
Figure 6. 5-color flow cytometry of whole blood samples shows different numbers of B cell subsets.
(A) Total B cells, as defined by CD19+ cells. The total B cell counts for TOL, SI, and HC cohorts were 287, 120, and 176 cells/μl, respectively. (B) Naive B cells, as defined by CD19+CD27IgM+IgD+ cells. The naive B cell counts for TOL, SI, and HC cohorts were 190, 61, and 90 cells/μl, respectively. (C) Memory B cells, as defined by CD27+IgM+IgD+. The mean numbers for the memory B cell subset were 54.2 and 20.8 cells/μl for TOL and HC, respectively. (D) CD86+ B cells, as defined by CD86+CD19+. Mean numbers of CD86+CD19+ B cells for TOL and HC cohorts were 22 and 4.5 cells/μl, respectively. All values are shown as log2 absolute numbers, a calculation of the percent of lymphocyte gate multiplied by the total wbc count obtained from the same sample on a Coulter Counter. Boxes depict IQR; whiskers denote 1.5 × IQR; values beyond this range are shown as outliers. P values are shown for statistically significant differences.
Figure 7
Figure 7. 9-color flow cytometry of frozen PBMCs from both ITN and European IOT samples.
(A) Total B cells, expressed as the percent CD19+ cells in the lymphocyte gate. (B) Naive B cells, defined as CD19+CD27IgD+, shown as the percent of the total CD19+ gate. (C) Transitional B cells, defined as CD19+CD38+CD24+IgD+, shown as the percent of the total CD19+ gate. Boxes depict IQR; whiskers denote 1.5 × IQR; values beyond this range are shown as outliers. P values are shown for statistically significant differences.
Figure 8
Figure 8. Intracellular cytokine staining of sorted B cells.
(A) Intracellular cytokine flow cytometric measures of IL-10 in unstimulated transitional B cells and in B cells stimulated with PMA and ionomycin revealed little to no transitional B cells expressing IL-10 in SI participants, with greater numbers of IL-10–expressing transitional B cells in TOL and HC participants in both unstimulated and PMA and ionomycin–stimulated groups. (B) Intracellular flow cytometric cytokine measures of TGFβ in unstimulated transitional B cells and transitional B cells stimulated with PMA and ionomycin revealed no differences in the number of TGFβ-expressing cells in the unstimulated or PMA and ionomycin–stimulated groups. Horizontal lines indicate median.

Comment in

Similar articles

Cited by

References

    1. Nankivell BJ, Borrows RJ, Fung CL, O’Connell PJ, Allen RD, Chapman JR. The natural history of chronic allograft nephropathy. N Engl J Med. 2003;349(24):2326–2333. doi: 10.1056/NEJMoa020009. - DOI - PubMed
    1. Meier-Kriesche HU, et al. Interaction of mycophenolate mofetil and HLA matching on renal allograft survival. Transplantation. 2001;71(3):398–401. doi: 10.1097/00007890-200102150-00010. - DOI - PubMed
    1. Lechler RI, Garden OA, Turka LA. The complementary roles of deletion and regulation in transplantation tolerance. Nat Rev Immunol. 2003;3(2):147–158. doi: 10.1038/nri1002. - DOI - PubMed
    1. Traum AZ, Kawai T, Vacanti JP, Sachs DH, Cosimi AB, Madsen JC. The need for tolerance in pediatric organ transplantation. Pediatrics. 2008;121(6):1258–1260. doi: 10.1542/peds.2008-0783. - DOI - PMC - PubMed
    1. Tinckam KJ, Sayegh MH. Transplantation tolerance in pediatric recipients: lessons and challenges. Pediatr Transplant. 2005;9(1):17–27. doi: 10.1111/j.1399-3046.2004.00220.x. - DOI - PubMed

Publication types

MeSH terms