. 2010 Jun;120(6):1939-49.
doi: 10.1172/JCI40124. Epub 2010 May 24.

Uric acid promotes an acute inflammatory response to sterile cell death in mice

Affiliations

Uric acid promotes an acute inflammatory response to sterile cell death in mice

Hajime Kono et al. J Clin Invest. 2010 Jun.

Abstract

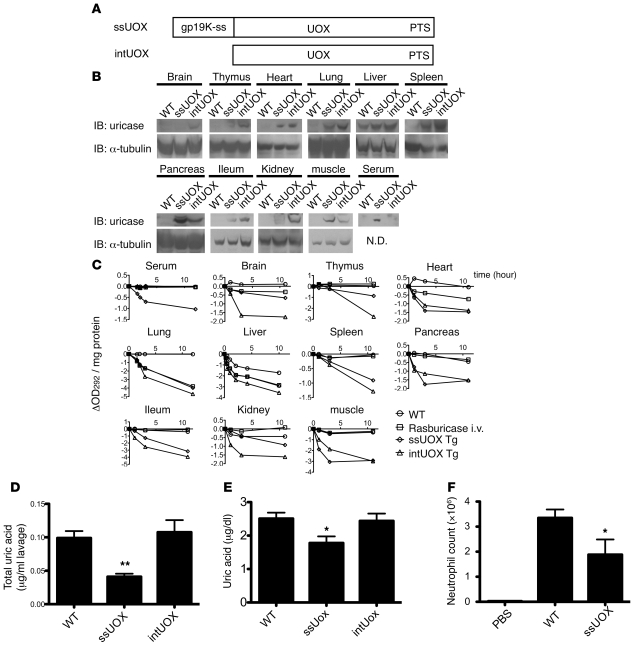
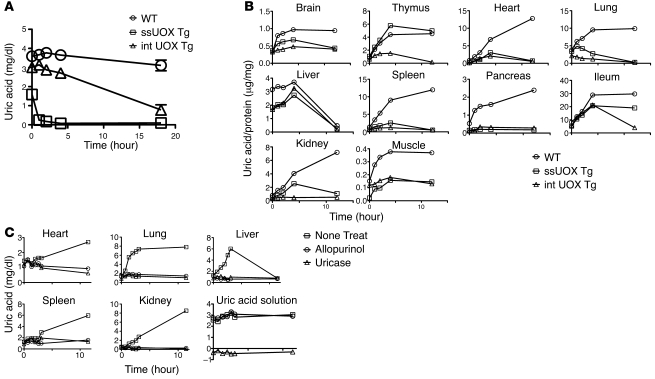
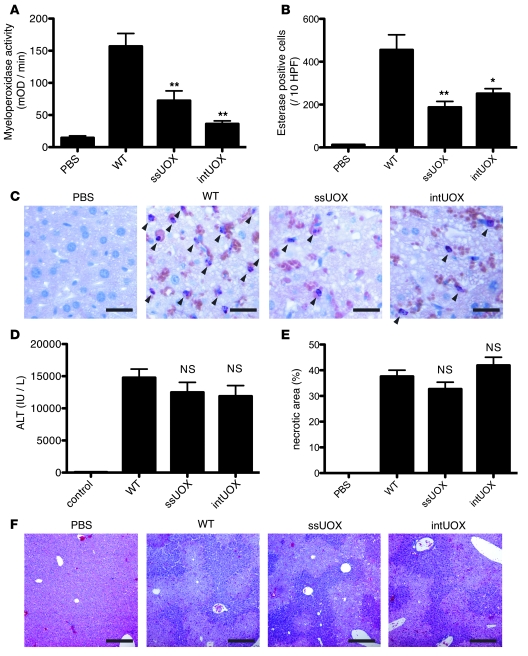
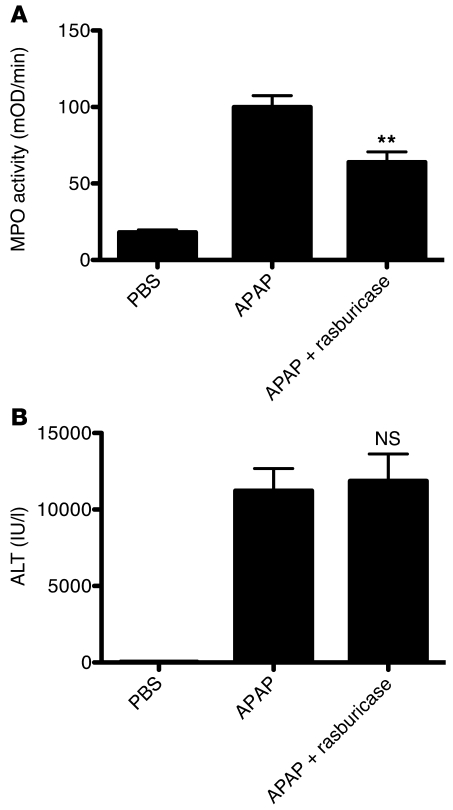
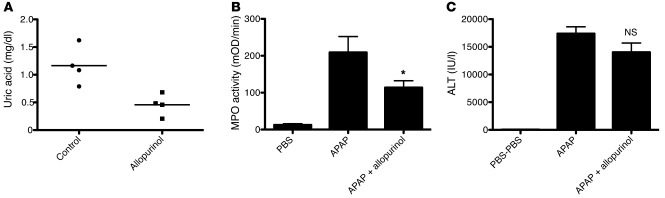
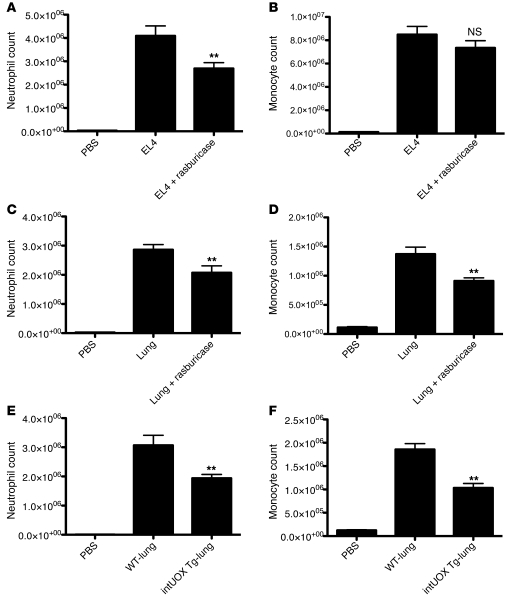
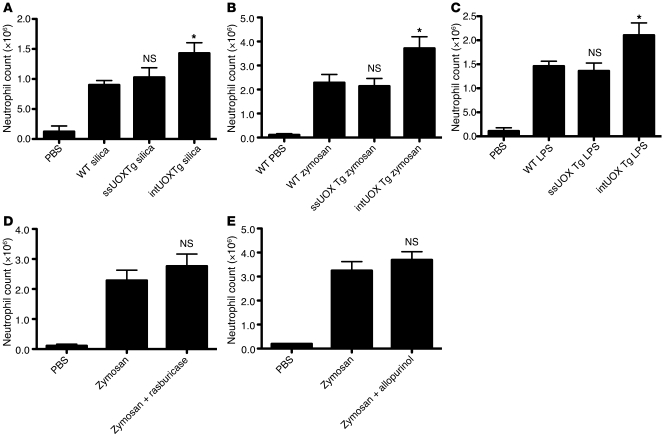
Necrosis stimulates inflammation, and this response is medically relevant because it contributes to the pathogenesis of a number of diseases. It is thought that necrosis stimulates inflammation because dying cells release proinflammatory molecules that are recognized by the immune system. However, relatively little is known about the molecular identity of these molecules and their contribution to responses in vivo. Here, we investigated the role of uric acid in the inflammatory response to necrotic cells in mice. We found that dead cells not only released intracellular stores of uric acid but also produced it in large amounts postmortem as nucleic acids were degraded. Using newly developed Tg mice that have reduced levels of uric acid either intracellularly and/or extracellularly, we found that uric acid depletion substantially reduces the cell death-induced inflammatory response. Similar results were obtained with pharmacological treatments that reduced uric acid levels either by blocking its synthesis or hydrolyzing it in the extracellular fluids. Importantly, uric acid depletion selectively inhibited the inflammatory response to dying cells but not to microbial molecules or sterile irritant particles. Collectively, our data identify uric acid as a proinflammatory molecule released from dying cells that contributes significantly to the cell death-induced inflammatory responses in vivo.


Figures

Figure 1
Figure 1. Generation and characterization of uricase Tg mice.
(A) Construct of uricase transgenes. Secreted uricase (ssUOX) was generated by N-terminal addition of a signal sequence for secretion derived from adenovirus gp19K (gp19K-ss). The unmodified intracellular uricase (intUOX) has a C-terminal peroxisome targeting signal sequence (PTS). (B) Western blot of uricase and α-tubulin (loading control) in organs of Tg or WT mice. (C) Uricase activity in organs and serum. WT C57BL/6 mice were injected with 9 μg of i.p. and 9 μg of i.v. rasburicase where indicated. Organs were harvested from untreated WT, uricase Tg mice, or WT mice 18 hours after rasburicase injection, and lysates were prepared. Twenty μl of lysate form various organs was added to 1 ml of uric acid solution (OD292 = 1.0) and incubated at 37°C for indicated periods of time. The uricase activity was measured by the decrease of OD292. (D) Amount of uric acid in peritoneal cavity in WT and uricase Tg mice (n = 6). (E) Plasma concentration of uric acid in WT and uricase Tg mice. Samples were drawn and immediately chilled on ice to prevent uricase from oxidizing uric acid ex vivo (n = 13–19). (F) Total neutrophil numbers in the peritoneal cavity after 15 hours after i.p. injection of 2 mg of monosodium urate crystal. n = 6 (PBS); n = 15 (WT); n = 8 (ssUOX). **P < 0.01; *P < 0.05 versus WT in (DF).
Figure 2
Figure 2. Generation of uric acid after cell death.
(A) Change of uric acid concentration in serum of WT and uricase Tg mice incubated ex vivo. Serum from uricase Tg mice was collected after being allowed to clot at room temperature and subsequently incubated at 37°C for the indicated times; uric acid concentration was measured (n = 32–36). (B) Generation of uric acid after cell death. Tissue lysates obtained from the indicated organs from uricase Tg mice or WT littermates were incubated at 37°C for indicated times. Uric acid content was normalized with protein concentration. (C) Postmortem uric acid is generated by xanthine oxidase. Tissue lysates were incubated at 37°C for indicated times in the presence of allopurinol (128 mg/l) or uricase (0.5 mg/ml). The uric acid concentrations in the tissue lysate are shown.
Figure 3
Figure 3. Reduced neutrophil recruitment to liver injury in uricase Tg mice.
Liver tissue MPO activity (A), number of esterase-positive cells (neutrophils) (B), histology of sections stained for esterase activity (C), serum ALT activity (D), quantification of necrotic area (E), and histology of liver sections stained with H&E (F) of WT and uricase Tg mice 18 hours after challenge with 300 mg/kg acetaminophen. Total numbers of mice used in A and D from 4 independent experiments were n = 6 (PBS control); n = 26 (WT); n = 24 (ssUOX); and n = 23 (intUOX). Total numbers of mice used in B and E were n = 6 (PBS control); n = 8 (WT); n = 5 (ssUOX); and n = 5 (intUOX). Means and SEM values are shown. **P < 0.01; *P < 0.05. NS, not significant versus control WT C57BL/6. (C) Representative images of esterase staining used in the analysis of B. Arrowheads indicate the esterase-positive cells. Scale bars: 25 mm. (F) Representative images of H&E staining used in the analysis of E. Scale bars: 250 mm.
Figure 4
Figure 4. Reduced neutrophil recruitment to liver injury in mice treated with rasburicase.
Liver tissue MPO activity (A) and serum ALT activity (B) of control and rasburicase-treated mice 18 hours after challenge with 300 mg/kg acetaminophen. n = 6 (PBS); n = 20 (APAP); n = 18 (APAP + rasburicase). Means and SEM values are for combined data from 4 independent experiments. **P < 0.01, versus control APAP alone group. NS, not significant versus APAP alone.
Figure 5
Figure 5. Reduced neutrophil recruitment to liver injury by allopurinol treatment.
(A) Uric acid concentration in liver lysate treated with 1 week of i.p. injections of allopurinol (10 mg/kg/d). Liver tissue MPO activity (B) and serum ALT activity (C) of control and allopurinol-treated mice 18 hours after challenge with 300 mg/kg acetaminophen. n = 6 (PBS); n = 17 (APAP); n = 17 (APAP + allopurinol). Means and SEM values are for combined data from 3 independent experiments. *P < 0.05, versus control APAP alone group. NS, not significant versus APAP alone.
Figure 6
Figure 6. Reduced neutrophil recruitment in the peritoneal cavity in response to rasburicase-treated necrotic cells or lung from uricase Tg mice.
Total neutrophil or monocyte numbers in the peritoneal cavity 15 hours after i.p. challenge with necrotic EL4 cells (A and B) or lung homogenate from WT C57BL/6 (C and D) with or without 18 μg of rasburicase. (E and F) Lung homogenate from WT or intracellular uricase Tg mice was injected i.p. into WT C57BL/6. Neutrophil or monocyte numbers in PEC were determined by counting the Ly-6G+7/4+ or Ly-6G7/4+cells in 100 μl of peritoneal lavage, respectively. Negative control: C57BL/6 mice challenged with PBS. Uric acid concentrations of EL4 cell suspension and WT lung homogenate injected were 5.4 mg/dl and 7.5 mg/dl, respectively. Means and SEM values are for combined data from 3 or more independent experiments. Number of mice used in (A and B): n = 8 (PBS); n = 15 (EL4); n = 16 (EL4 + rasburicase); (C and D): n = 10 (PBS); n = 24 (lung); n = 23 (lung + rasburicase); (E and F): n = 4 (PBS); n = 10 (WT-lung); n = 10 (intUOX Tg-lung). **P < 0.01; NS, not significant versus control necrotic EL4 without rasburicase (A and B), lung homogenate without rasburicase (C and D), or WT-lung (E and F).
Figure 7
Figure 7. No decrease in neutrophil recruitment to silica crystals, zymosan, or LPS in uricase Tg mice or mice treated with rasburicase or allopurinol.
Total number of neutrophils in the peritoneal cavity 15 hours after i.p. injection into WT or uricase Tg mice of 0.5 mg of silica crystal (A), 0.2 mg zymosan in uricase Tg mice (B), 100 ng of ultrapure LPS (C), or rasburicase-treated mice (D), or injection of zymosan into control, or allopurinol-treated mice (E). Means and SEM values are for combined data from 3 or more independent experiments. Number of mice used in (A): n =5 (PBS), n =11 (WT silica), n =8 (ssUOX Tg silica); 6 (intUOX Tg silica); (B): n = 4 (PBS); n = 15 (WT zymosan); n = 15 (ssUOX Tg zymosan); n = 17 (intUOX Tg zymosan); (C): n = 9 (PBS); n = 9 (WT LPS); n = 9 (ssUOX Tg LPS); n = 9 (intUOX Tg LPS); (D): n = 4 (PBS); n =15 (zymosan); n = 14 (zymosan + rasburicase); (E) n = 4 (PBS); n = 9 (zymosan); n = 9 (zymosan + allopurinol). *P < 0.05; NS, not significant versus WT silica (A), WT zymosan (B), or WT LPS (C).

Comment in

  • J Clin Invest. 120:1809.

References

    1. Majno G, La Gattuta M, Thompson TE. Cellular death and necrosis: chemical, physical and morphologic changes in rat liver. Virchows Arch Pathol Anat Physiol Klin Med. 1960;333:421–465. doi: 10.1007/BF00955327. - DOI - PubMed
    1. Acute myocardial infarction. In: Braunwald E, Zipes DP, and Libby P, eds.Heart Disease: A Textbook of Cardiovascular Medicine . 6th ed. Philadelphia, PA: WB Saunders; 2001:1114–1231.
    1. Majno G, Joris I. Apoptosis, oncosis, and necrosis. An overview of cell death. Am J Pathol. 1995;146(1):3–15. - PMC - PubMed
    1. Romson JL, Hook BG, Kunkel SL, Abrams GD, Schork MA, Lucchesi BR. Reduction of the extent of ischemic myocardial injury by neutrophil depletion in the dog. Circulation. 1983;67(5):1016–1023. - PubMed
    1. Sawa Y, et al. Leukocyte depletion attenuates reperfusion injury in patients with left ventricular hypertrophy. Circulation. 1996;93(9):1640–1646. - PubMed

Publication types