. 2010 Jun;120(6):1950-60.
doi: 10.1172/JCI38369. Epub 2010 May 24.

The antifibrotic effects of plasminogen activation occur via prostaglandin E2 synthesis in humans and mice

Affiliations

The antifibrotic effects of plasminogen activation occur via prostaglandin E2 synthesis in humans and mice

Kristy A Bauman et al. J Clin Invest. 2010 Jun.

Abstract

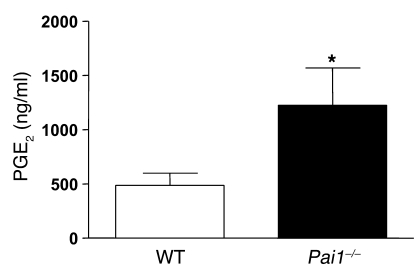
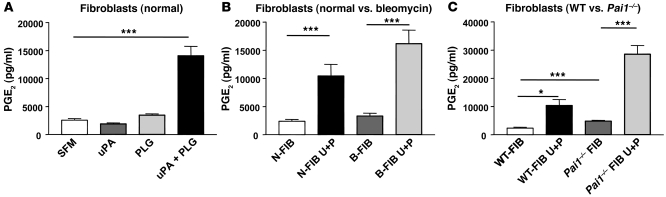
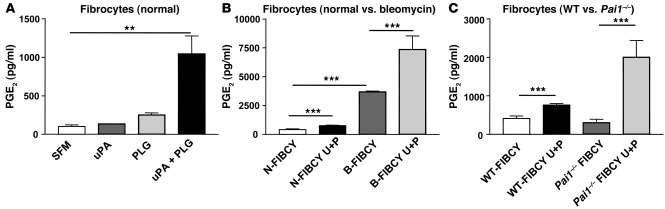
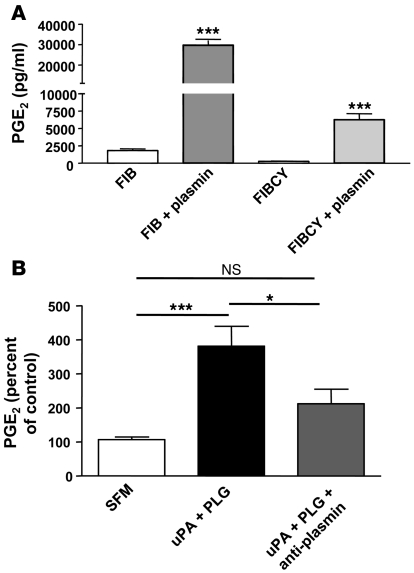
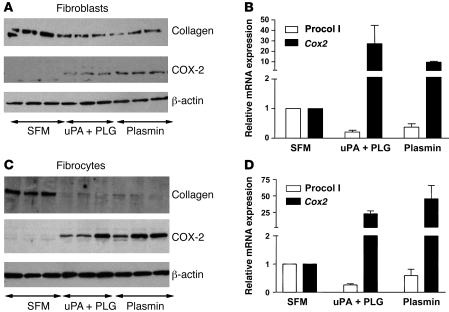
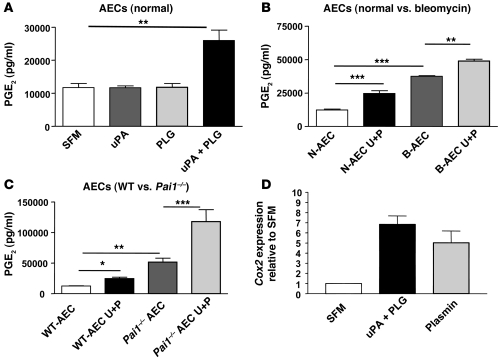
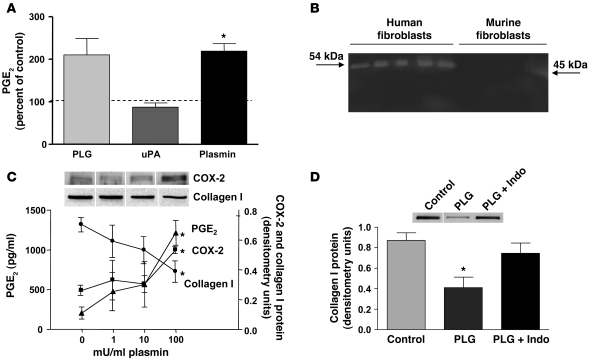
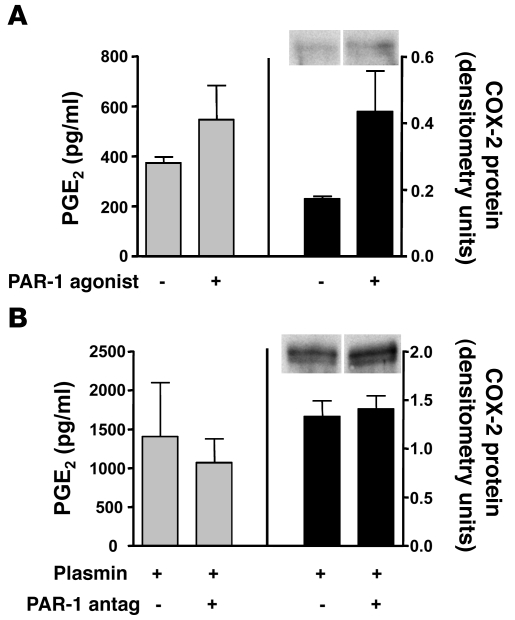
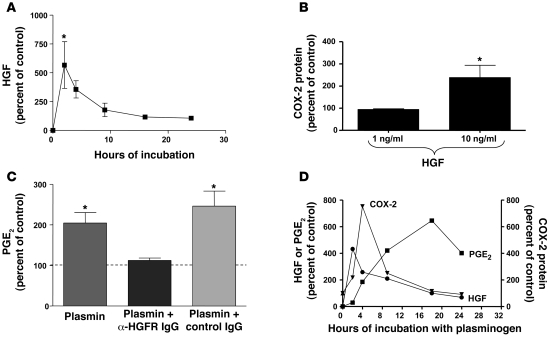
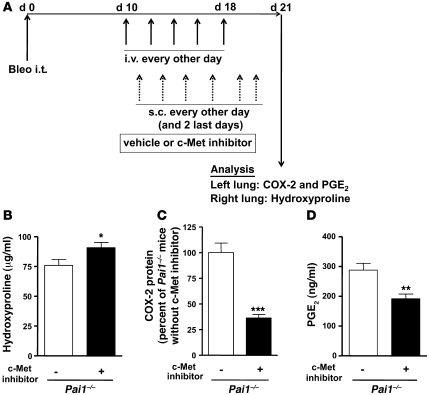
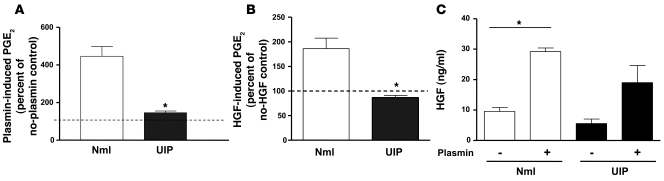
Plasminogen activation to plasmin protects from lung fibrosis, but the mechanism underlying this antifibrotic effect remains unclear. We found that mice lacking plasminogen activation inhibitor-1 (PAI-1), which are protected from bleomycin-induced pulmonary fibrosis, exhibit lung overproduction of the antifibrotic lipid mediator prostaglandin E2 (PGE2). Plasminogen activation upregulated PGE2 synthesis in alveolar epithelial cells, lung fibroblasts, and lung fibrocytes from saline- and bleomycin-treated mice, as well as in normal fetal and adult primary human lung fibroblasts. This response was exaggerated in cells from Pai1-/- mice. Although enhanced PGE2 formation required the generation of plasmin, it was independent of proteinase-activated receptor 1 (PAR-1) and instead reflected proteolytic activation and release of HGF with subsequent induction of COX-2. That the HGF/COX-2/PGE2 axis mediates in vivo protection from fibrosis in Pai1-/- mice was demonstrated by experiments showing that a selective inhibitor of the HGF receptor c-Met increased lung collagen to WT levels while reducing COX-2 protein and PGE2 levels. Of clinical interest, fibroblasts from patients with idiopathic pulmonary fibrosis were found to be defective in their ability to induce COX-2 and, therefore, unable to upregulate PGE2 synthesis in response to plasmin or HGF. These studies demonstrate crosstalk between plasminogen activation and PGE2 generation in the lung and provide a mechanism for the well-known antifibrotic actions of the fibrinolytic pathway.


Figures

Figure 1
Figure 1. Bleomycin-treated Pai1–/– mice overproduce PGE2.
WT or Pai1–/– mice were injected with bleomycin on day 0. On day 21, lungs were removed and homogenized. Lipids were extracted using C18 cartridges, and levels of PGE2 were measured by ELISA; n = 5, *P = 0.03.
Figure 2
Figure 2. Plasminogen activation stimulates PGE2 release in fibroblasts.
(A) Fibroblasts from saline-treated mice were cultured at 5 × 10⁵/ml and serum starved for 24 hours. Cells were then treated with SFM, 10 U/ml uPA, 45 mU/ml plasminogen (PLG), or uPA plus PLG for 24 hours. PGE2 was then measured by ELISA in cell supernatants; n = 5, ***P < 0.001. (B) Mice were given i.t. saline or i.t. bleomycin on day 0. On day 14, lungs were harvested, minced, and cultured until day 28. Fibroblasts from normal and bleomycin-treated mice (N-FIB and B-FIB, B) were cultured in SFM or with uPA plus PLG (U+P) for 24 hours, and PGE2 was measured; n = 5 or more in all groups, ***P < 0.001. (C) Fibroblasts were purified from WT or Pai1–/– mice and were treated with SFM or uPA plus PLG for 24 hours before culture supernatants were analyzed for PGE2 production via ELISA; n = 5 or more in each group, *P < 0.05, ***P < 0.001.
Figure 3
Figure 3. Plasminogen activation stimulates PGE2 release in fibrocytes.
(A) Fibrocytes from saline-treated mice were cultured at 5 × 10⁵/ml and serum starved for 24 hours. Cells were then treated with SFM, 10 U/ml uPA, 45 mU/ml PLG, or uPA plus PLG for 24 hours. PGE2 was then measured by ELISA in cell supernatants; n = 3, **P < 0.01. (B) Mice were given i.t. saline or i.t. bleomycin on day 0. On day 14, lungs were harvested, minced, and cultured until day 28. Fibrocytes were then purified. Fibrocytes (FIBCY) from saline-treated, normal, and bleomycin-treated mice (B) were cultured in SFM or with uPA plus PLG for 24 hours, and PGE2 was measured; n = 5, ***P < 0.001. (C) Fibrocytes were purified from WT or Pai1–/– mice and were treated with SFM or uPA plus PLG for 24 hours before culture supernatants were analyzed for PGE2 production via ELISA; n = 4, ***P < 0.001.
Figure 4
Figure 4. Induction of PGE2 synthesis in mouse lung mesenchymal cells requires plasmin enzymatic activity.
(A) Fibroblasts and fibrocytes were purified from saline-treated lungs, serum starved overnight, and cultured for 24 hours in SFM or with 50 mU/ml plasmin. PGE2 was then measured in cell-free supernatants; n = 3, ***P < 0.001. (B) Fibroblasts from saline-treated mice were cultured in the presence of SFM, 10 U/ml uPA plus 45 mU/ml PLG, or uPA plus PLG plus 30 μg/ml α2-antiplasmin; n = 7 per group, *P < 0.05, ***P < 0.001.
Figure 5
Figure 5. Plasminogen activation induces COX-2 and limits collagen I production in mouse lung mesenchymal cells.
Fibroblasts (A and B) and fibrocytes (C and D) from saline-treated mice were cultured for 24 hours in the presence of SFM alone, 10 U/ml uPA plus 45 mU/ml PLG, or 50 mU/ml plasmin. Cell lysates were prepared and analyzed by Western blot for expression of collagen I and COX-2 (A and C). Each lane represents a unique culture. Data are representative of 2 independent experiments. In B and D, total RNA was made from cells cultured as above and analyzed for expression of Cox2 and the α1 chain of procollagen I (Procol I) by real-time RT-PCR. Values were first normalized to expression of β-actin in each sample. Then, the average of the n = 3 SFM-treated cultures was normalized to 1 for each gene.
Figure 6
Figure 6. Plasminogen activation stimulates PGE2 release in AECs.
(A) AECs from saline-treated mice were cultured at 1.5 × 10⁶/ml on fibronectin-coated plates and serum starved for 24 hours. Cells were then treated with SFM, 10 U/ml uPA, 45 mU/ml PLG, or uPA + PLG for 24 hours. PGE2 was then measured by ELISA in cell supernatants; n = 4, **P < 0.01. (B) Mice were given i.t. saline or i.t. bleomycin on day 0. On day 14, AECs were purified. AECs from saline-treated, normal and bleomycin-treated mice (N-AEC and B-AEC, B) were cultured in SFM or with uPA plus PLG for 24 hours, and PGE2 was measured; n = 3 or more in all groups, **P < 0.01, ***P < 0.001. (C) AECs were purified from WT or Pai1–/– mice and were treated with SFM or uPA plus PLG for 24 hours before culture supernatants were analyzed for PGE2 production via ELISA; n = 4 or more in each group, *P < 0.05, **P < 0.01, ***P < 0.001. (D) AECs were purified from saline-treated mice and cultured at 1.5 × 10⁶/ml on fibronectin-coated plates. Cells were serum starved overnight and then cultured in SFM, 10 U/ml uPA plus 45 mU/ml PLG, or with 50 mU/ml plasmin. Total RNA was prepared and analyzed for Cox2 via real-time RT-PCR. Values for each sample were first normalized to β-actin, then the mean value for the SFM group was normalized to 1. n = 2 per group, representative of 2 experiments.
Figure 7
Figure 7. IMR-90 cell PGE2 synthesis is regulated by plasminogen activation.
(A) IMR-90 cells in SFM were treated with PLG (200 mU/ml), plasmin (100 mU/ml), or uPA (10 U/ml) for 18 hours. Medium was removed from the cells, and PGE2 was measured by ELISA and is expressed relative to the control value measured in SFM alone; n ≥ 5, *P < 0.05 versus control. (B) Cell supernatants were collected from either saline-treated murine lung fibroblasts or human IMR-90 cells cultured at equal densities for 24 hours. Supernatants were then analyzed by zymography for the ability to activate PLG. A band of the appropriate size for human uPA (54 kDa) is readily distinguishable in the IMR-90 cell supernatants, but the lower-molecular-weight murine uPA band (45 kDa) is very faint in the murine lung fibroblasts; n = 5 per group. (C) IMR-90 cells in SFM were treated with 100 mU/ml plasmin for 18 hours. Media was harvested for PGE2 determination (triangles), and lysates were harvested for collagen I protein expression (circles) or COX-2 protein expression (squares) as determined by immunoblot analysis and densitometry using α-tubulin as a loading control; n = 3, *P < 0.05 versus control. Collagen I and COX-2 immunoblots are representative of experiments performed in triplicate. (D) IMR-90 cells were treated with SFM (control), PLG (100 mU/ml), or PLG plus indomethacin (Indo; 10 μM) for 18 hours, and collagen I was determined by immunoblot analysis and densitometry using α-tubulin as a loading control; n = 3, *P < 0.05 versus control. Collagen I immunoblots are representative of experiments performed in triplicate. Blots in both C and D are composed from lanes that were run on the same gel but were noncontiguous.
Figure 8
Figure 8. Lack of effect of PAR-1 agonist and antagonist peptides on PGE2 production and COX-2 expression in IMR-90 cells.
(A) IMR-90 cells in SFM were treated with the PAR-1 agonist peptide TFLLRN (100 μM) for 18 hours; n = 3. (B) IMR-90 cells in SFM were treated with plasmin (100 mU/ml) with and without the PAR-1 antagonist peptide FLLRN (antag; 100 μM) for 18 hours; n = 3. Where plasmin and FLLRN were coincubated, the antagonist was added 10 minutes before the plasmin. Lysates were harvested, and COX-2 protein expression was determined by immunoblot analysis and densitometry using α-tubulin as a loading control. Medium was removed from the cells for PGE2 determination. COX-2 immunoblots in A and B are derived from the same experiments, so that differences in densitometric units accurately reflect differences between plasmin (B) and no-plasmin control (A) conditions. None of the comparisons shown represent statistically significant differences. Blots in both A and B are composed from two lanes that were run on the same gel but were noncontiguous.
Figure 9
Figure 9. Plasmin induces IMR-90 cell COX-2 expression and PGE2 synthesis in an HGF-dependent manner.
(A) IMR-90 cells in SFM were treated with plasmin (50 mU/ml) for 2, 4, 9, 18, and 24 hours. Total HGF was determined by ELISA and normalized to levels measured in cells incubated with SFM alone; n = 3, *P < 0.05 versus control. At 2 hours, the mean absolute concentration of HGF was 6.12 ng/ml. (B) IMR-90 cells in SFM were treated with HGF (1 or 10 ng/ml) for 18 hours. Lysates were harvested for COX-2 protein expression as determined by immunoblot analysis and densitometry using α-tubulin as a loading control; n = 3, *P = 0.05 versus control (SFM alone). (C) IMR-90 cells in SFM were treated with plasmin (50 mU/ml), plasmin with an HGF receptor blocking antibody (20 μg/ml), or plasmin with a nonspecific IgG (control IgG; 20 μg/ml) for 18 hours (n = 3). PGE2 was determined and normalized for cellular protein. *P < 0.05 versus control (SFM alone). (D) IMR-90 cells in SFM were treated with PLG (200 mU/ml) for 2, 4, 9, 18, and 24 hours. Lysates were harvested for COX-2 protein expression (inverted triangles) as determined by immunoblot analysis and densitometry using α-tubulin as a loading control. Media was harvested, and PGE2 (squares) and HGF (circles) were determined and normalized to cellular protein. Data are expressed relative to SFM control and are from 1 experiment representative of 2.
Figure 10
Figure 10. A c-Met inhibitor increases collagen deposition in the lungs of Pai1–/– mice in parallel with reductions in COX-2 expression and PGE2 production.
(A) Protocol. Pai1–/– mice were injected with bleomycin (Bleo) on day 0 and were treated with vehicle (l-lactate and 10% polyethylene glycol) alone (control, n = 6) or with the c-Met inhibitor PHA-665752 (25 mg/kg) (n = 7) in vehicle. On alternate days, administration was i.v. via tail vein or s.c., as shown. On day 21, lungs were harvested. (B) Collagen deposition in the right lung was determined by measuring hydroxyproline content. (C) COX-2 levels in left lung homogenates were determined by immunoblot analysis and densitometry. Data are expressed as percent of vehicle-treated mice. (D) PGE2 levels in the lipid extracts from left lungs were measured by ELISA. *P < 0.05, **P < 0.01, ***P < 0.001 versus control. Similar results were obtained in a second experiment.
Figure 11
Figure 11. Plasmin and HGF are unable to upregulate PGE2 production in fibroblasts from patients with IPF.
Fibroblasts from IPF patients diagnosed with UIP or fibroblasts obtained from histologically normal (Nml) lung resections were cultured in SFM (control) with or without plasmin (100 mU/ml) (A) or HGF (10 ng/ml) (B) for 18 hours. Medium was removed, and PGE2 levels were determined by ELISA. The SFM (control) sample for each cell line was normalized to 100% (dotted lines). Data are from cells derived from n = 3 patients per group. *P < 0.05 versus Nml. (C) Fibroblasts from Nml and UIP lung were treated with SFM alone (control) or plasmin (100 mU/ml) for 2 hours (based on the kinetics of HGF release shown in Figure 9A), and HGF levels in the supernatants were determined by ELISA. Data are from cells derived from n = 3 patients per group; *P < 0.05 versus control Nml without plasmin.

References

    1. Bertozzi P, et al. Depressed bronchoalveolar urokinase activity in patients with adult respiratory distress syndrome. N Engl J Med. 1990;322(13):890–897. - PubMed
    1. Chapman HA, Allen CL, Stone OL. Abnormalities in pathways of alveolar fibrin turnover among patients with interstitial lung disease. Am Rev Respir Dis. 1986;133(3):437–443. - PubMed
    1. Idell S, et al. Local abnormalities in coagulation and fibrinolytic pathways predispose to alveolar fibrin deposition in the adult respiratory distress syndrome. J Clin Invest. 1989;84(2):695–705. doi: 10.1172/JCI114217. - DOI - PMC - PubMed
    1. Eitzman DT, et al. Bleomycin-induced pulmonary fibrosis in transgenic mice that either lack or overexpress the murine plasminogen activator inhibitor-1 gene. J Clin Invest. 1996;97(1):232–237. doi: 10.1172/JCI118396. - DOI - PMC - PubMed
    1. Swaisgood CM, French EL, Noga C, Simon RH, Ploplis VA. The development of bleomycin-induced pulmonary fibrosis in mice deficient for components of the fibrinolytic system. Am J Pathol. 2000;157(1):177–187. - PMC - PubMed

Publication types

MeSH terms