. 2010 May 20;6(5):e1000907.
doi: 10.1371/journal.ppat.1000907.

Leishmania donovani isolates with antimony-resistant but not -sensitive phenotype inhibit sodium antimony gluconate-induced dendritic cell activation

Affiliations

Leishmania donovani isolates with antimony-resistant but not -sensitive phenotype inhibit sodium antimony gluconate-induced dendritic cell activation

Arun Kumar Haldar et al. PLoS Pathog. .

Abstract

The inability of sodium antimony gluconate (SAG)-unresponsive kala-azar patients to clear Leishmania donovani (LD) infection despite SAG therapy is partly due to an ill-defined immune-dysfunction. Since dendritic cells (DCs) typically initiate anti-leishmanial immunity, a role for DCs in aberrant LD clearance was investigated. Accordingly, regulation of SAG-induced activation of murine DCs following infection with LD isolates exhibiting two distinct phenotypes such as antimony-resistant (Sb(R)LD) and antimony-sensitive (Sb(S)LD) was compared in vitro. Unlike Sb(S)LD, infection of DCs with Sb(R)LD induced more IL-10 production and inhibited SAG-induced secretion of proinflammatory cytokines, up-regulation of co-stimulatory molecules and leishmanicidal effects. Sb(R)LD inhibited these effects of SAG by blocking activation of PI3K/AKT and NF-kappaB pathways. In contrast, Sb(S)LD failed to block activation of SAG (20 microg/ml)-induced PI3K/AKT pathway; which continued to stimulate NF-kappaB signaling, induce leishmanicidal effects and promote DC activation. Notably, prolonged incubation of DCs with Sb(S)LD also inhibited SAG (20 microg/ml)-induced activation of PI3K/AKT and NF-kappaB pathways and leishmanicidal effects, which was restored by increasing the dose of SAG to 40 microg/ml. In contrast, Sb(R)LD inhibited these SAG-induced events regardless of duration of DC exposure to Sb(R)LD or dose of SAG. Interestingly, the inhibitory effects of isogenic Sb(S)LD expressing ATP-binding cassette (ABC) transporter MRPA on SAG-induced leishmanicidal effects mimicked that of Sb(R)LD to some extent, although antimony resistance in clinical LD isolates is known to be multifactorial. Furthermore, NF-kappaB was found to transcriptionally regulate expression of murine gammaglutamylcysteine synthetase heavy-chain (mgammaGCS(hc)) gene, presumably an important regulator of antimony resistance. Importantly, Sb(R)LD but not Sb(S)LD blocked SAG-induced mgammaGCS expression in DCs by preventing NF-kappaB binding to the mgammaGCS(hc) promoter. Our findings demonstrate that Sb(R)LD but not Sb(S)LD prevents SAG-induced DC activation by suppressing a PI3K-dependent NF-kappaB pathway and provide the evidence for differential host-pathogen interaction mediated by Sb(R)LD and Sb(S)LD.


Conflict of interest statement

The authors have declared that no competing interests exist.

Figures
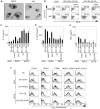
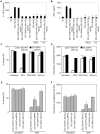
Figure 1
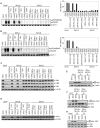
Figure 1. SAG treatment exhibits differential effect on SbRLD- and SbSLD-infected DCs.
(A) BMDCs and ex vivo derived sDCs were infected with 2001 promastigotes (SbSLD) in vitro at a MOI of 10∶1 for overnight, washed thoroughly to remove free parasites and localization of intracellular LD parasites was ascertained via Giemsa staining. (B) BMDCs and sDCs were infected in vitro with GFP-2001 (SbSLD) or GFP-R5 (SbRLD) promastigotes, as described above, for 3 hours or left uninfected. Free parasites were removed from DCs by thorough washing. The LD-infected DCs were then cultured with or without SAG treatment (20 µg/ml) for another 24 hours whereas uninfected DCs were left untreated. DCs were immunostained with αCD11c-PE and LD infection in DC was analyzed by FACS. Numbers in upper right quadrant indicate the percentage of LD-infected DCs as represented by CD11c+GFP+ cells. In some experiments (C-F), BMDCs were infected with SbSLD (AG83, 2001) or SbRLD (39, GE1F8R) strains for 3 hours or left uninfected as described above. DCs were then washed to remove free parasites and stimulated with SAG (20 µg/ml) for 48 hours and (C) IL-10, (D) IL-12p70 and (E) TNFα secretion in culture supernatants were measured via ELISA or (F) surface expression of co-stimulatory molecules and MHCs measured via FACS. Open histograms represent untreated DCs and shaded histograms represent DCs plus SAG. For this and all other figures the label “Uninf” represents uninfected DCs. Data are the representative of three independent experiments. *p<0.001 versus DC+AG83; p = 0.001, #p = 0.002 and **p = 0.003 versus DC+2001; p<0.001, ††p = 0.004 and §p = 0.002 versus DC+SAG (Student's t test). Error bars indicate mean ± SD.
Figure 2
Figure 2. Stimulation with SAG increases nuclear NF-κB DNA binding activity in BMDCs.
BMDCs were treated with SAG (20 µg/ml) or specified concentrations of sodium gluconate (SG) for indicated times or left untreated. (A, C-D) DNA binding activity of nuclear NF-κB to H2K-specific oligonucleotide probe was measured via EMSA. The OCT-1 DNA binding was used as an internal control. Densitometric analysis represents the ratio of intensity of NF-κB to OCT-1 binding per unit area and is represented as arbitrary units. (B) Binding of different NF-κB complexes to H2K-DNA probe was determined by supershift EMSA using rabbit IgG (Control Ab) or Abs specific for different NF-κB subunits. For this and all other figures, control (Cont) lane represents uninfected DCs without SAG stimulation. Data are representative of three independent experiments. Error bars indicate mean ± SD.
Figure 3
Figure 3. SAG-treated BMDCs exhibit increased phosphorylation and degradation of IκB proteins and IKK activity.
BMDCs were untreated or stimulated either with 20 µg/ml SAG (A-F) or 500 ng/ml LPS (D-F) for specified times. (A) Expression of IκBα, IκBβ, IκBε and β-actin protein in cytoplasmic extracts was detected by Western blot using the same blot. Densitometric analyses represent the ratio of intensity of the corresponding IκB protein to β-actin expression per unit area and are represented as an arbitrary unit. (B) Cytoplasmic phospho-IκBα versus β-actin protein expression was detected via Western blot with the same blot. (C) In vitro IKK activity was determined by measuring phosphorylation of an IκBα-GST substrate. IKK1 and IKK2 protein expression in immunoprecipitated samples was analyzed via Western blot. Densitometric analysis indicates the intensity of phosphorylated (P) IκBα-GST substrate in an arbitrary unit. The levels of (D) phospho-p38MAPK versus p38MAPK, (E) phospho-ERK versus ERK and (F) phospho-JNK versus JNK protein expression in whole cell lysates were determined via Western blot. Data are representative of three independent experiments. Error bars indicate mean ± SD.
Figure 4
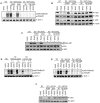
Figure 4. SAG-induced NF-κB signaling is inhibited in SbRLD- and not SbSLD-infected DCs.
BMDCs were infected in vitro with promastigotes (Pm) (A, C, E-F) or amastigotes (Am) (B, D, G) of specified strains of SbSLD or SbRLD at a MOI 10∶1 for indicated times or left uninfected. DCs were then stimulated with SAG (20 µg/ml) for 0.3 hours. (A-B) Nuclear DNA binding of NF-κB to H2K-specific probe was measured via EMSA. DNA binding of OCT-1 was used as internal control. Densitometric analyses were determined by measuring the ratio of intensity of NF-κB to OCT-1 binding per unit area and represented as arbitrary units. (C-D) Cytoplasmic IκBα, IκBβ, IκBε and β-actin protein were detected via Western blot with same blot. (E) Phospho-IκBα was detected by Western blot. The same blot was reprobed for β-actin. (F-G) In vitro IKK activity and expression of IKK1 and IKK2 were determined as in Figure 3. Data are representative of three independent experiments. Error bars indicate mean ± SD.
Figure 5
Figure 5. DC pretreatment with antigens or culture supernatant of SbRLD inhibits SAG-induced NF-κB pathway.
BMDCs were either pretreated with antigens prepared from indicated strains of SbSLD (SbSLDsAg) or SbRLD (SbRLDsAg) (A-C) or cultured in RPMI 1640 complete medium containing culture supernatants of indicated strains of SbSLD (SbSLDs) or SbRLD (SbRLDs) at a complete medium to supernatant ratios of 1∶1 (D) or 1∶3 (D-F) for 3 hours. BMDCs were then washed and stimulated with SAG (20 µg/ml) for 0.3 hours. (A, D-E) Nuclear NF-κB binding to H2K-DNA probe or OCT-1 DNA binding was measured via EMSA. (B, F) Cytoplasmic IκBα, IκBβ, IκBε and β-actin expression were detected by Western blot using the same blot. (C) In vitro IKK activity was determined as in Figure 3 and the same blot was reprobed for IKK1 and IKK2 protein. Data are representative of three independent experiments.
Figure 6
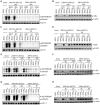
Figure 6. SAG-induced NF-κB activation is restored in SbSLD- but not SbRLD-infected DCs despite prolonged infection.
BMDCs were infected with promastigotes of 2001 (2001Pm) (SbSLD) and 39 (39Pm) (SbRLD) (A-B, E-F); or amastigotes of 2001 (2001Am) (SbSLD) and 39 (39Am) (SbRLD) (C-D, G-H) for indicated times at MOIs as specified (A-D) or 10∶1 (E-H). BMDCs were then stimulated with specified concentrations of SAG for 0.3 hours. (A, C, E, G) Nuclear NF-κB binding to H2K-DNA probe or OCT-1 DNA binding was measured via EMSA. (B, D, F, H) Cytoplasmic IκBα and β-actin expression were detected by Western blot using the same blot. SAG20 and SAG40 represent stimulation of BMDCs with 20 and 40 µg/ml of SAG, respectively. Data are representative of three independent experiments.
Figure 7
Figure 7. PI3K/AKT suppression by SbRLD inhibits SAG-induced NF-κB signaling in an IL-10 independent manner.
BMDCs were infected with promastigotes of SbSLD strains 2001(2001Pm) (E, G-J) and AG83 (AG83Pm) (H), and SbRLD strains 39 (39Pm) (E, G-J) and GE1F8R (GE1F8Pm) (H); or amastigotes of 2001(2001Am) and 39 (39Am) (F) for indicated times or left uninfected as described in Figure 4. Subsequently, BMDCs were stimulated or not with 20 (A-J) or 40 (G) µg/ml of SAG for specified times. For experiments (A-D), uninfected BMDCs were treated with 200 nM Wort or 50 µM Ly for 1 hour prior to SAG stimulation. In some experiments (I-J), BMDCs infected with 2001Pm (SbSLD) or 39Pm (SbRLD) for 3 or 24 hours were treated with 10 µg/ml of neutralizing αIL-10 mAb or isotype control Ab as described in Materials and Methods section or left untreated, and stimulated with SAG. (A, E-G, I) AKT phosphorylation in cytoplasmic extract was determined via Western blot and the same blot was reprobed for AKT protein. (B) In vitro IKK activity was measured as in Figure 3. IKK1 and IKK2 protein expression were determined via Western blot using the same blot. (C) Cytoplasmic IκBα and β-actin were detected by Western blot with the same blot. (D, J) Nuclear DNA binding activity of NF-κB to H2K-DNA probe or OCT-1 DNA binding was determined via EMSA. (H) Secretion of IL-10 was measured via ELISA. SAG20 and SAG40 represent stimulation of BMDCs with 20 and 40 µg/ml of SAG, respectively. Data are representative of three independent experiments. *p<0.005 versus DC; p<0.005, p = 0.006 and §p = 0.007 versus DC+AG83Pm; #p<0.005 versus DC+2001Pm of respective times (Student's t test). Error bars indicate mean ± SD.
Figure 8
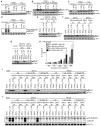
Figure 8. 2001Pm-MRPA but not 2001Pm inhibits SAG-induced AKT phosphorylation and DNA binding activity of NF-κB.
BMDCs were infected for 3 hours with 2001Pm (SbSLD), 39Pm (SbRLD), 2001Pm expressing MRPA (2001Pm-MRPA) or 2001Pm transfected with empty vector (2001Pm-EV) and stimulated with 20 µg/ml of SAG as described in Figure 4. (A) Expression of phosphorylated (P) AKT and AKT were measured in whole cell lysates via Western blot using the same membrane. Densitometric readings represent the ratio of intensity of phosphorylated (P) AKT protein to AKT expression per unit area and are represented as arbitrary units. (B) Nuclear NF-κB and OCT-1 DNA binding activities were measured via EMSA. Densitometric analysis represents the ratio of intensity of NF-κB to OCT-1 binding per unit area and is represented as arbitrary units. Data are representative of two independent experiments. Error bars indicate mean ± SD.
Figure 9
Figure 9. SbRLD inhibits SAG-induced proinflammatory cytokine production and leishmanicidal effects by suppressing PI3K/AKT pathway.
BMDCs were infected for 3 hours with SbRLD strain 39Pm (A-F); SbSLD strain 2001Pm (A-F); 2001Pm expressing MRPA (2001Pm-MRPA) (E-F); or 2001Pm transfected with empty vector (2001Pm-EV) (E-F) or left uninfected as described in Figure 4. BMDCs were washed and then stimulated with SAG (20 µg/ml) for 48 (A-B) or 24 (C-F) hours. For experiments (A-D); uninfected BMDCs (A-B), and BMDCs infected with 2001Pm (SbSLD) (A-D) or 39Pm (SbRLD) (C-D) were treated with 200 nM Wort or 50 µM Ly for 1 hour prior to SAG treatment. (A-B) Secretion of IL-12 (A) and TNFα (B) were determined by ELISA. (C-F) Giemsa staining was performed to determine the percentage of infected BMDCs (C, E) and number of intracellular amastigotes per 1000 BMDCs (D, F). Data are representative of three independent experiments. *p<0.001 and p<0.005 versus DC+SAG; **p<0.001 and ††p<0.005 versus DC+2001Pm+SAG; #p<0.04 versus DC+2001Pm (SbSLD) or DC+2001Pm-EV (Student's t test). Error bars indicate mean ± SD.
Figure 10
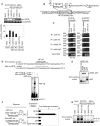
Figure 10. Suppression of SAG-induced mγGCShc expression by SbRLD is NF-κB-dependent.
Both uninfected BMDCs (A, C-E, G) and BMDCs infected with 2001Pm (SbSLD) or 39Pm (SbRLD) for 3 hours (A, G) were stimulated with SAG (20 µg/ml) for specified times as in Figure 4. (A) The mRNA expression of mγGCShc versus mGAPDH was determined via RT-PCR. Densitometric data represent ratio of intensity of mγGCShc to mGAPDH mRNA expression per unit area and are presented as an arbitrary unit. (B) Schematic presentation of mγGCShc promoter indicating the position of NF-κB binding site and ChIP primers (P1, P2). (C) NF-κB binding to −991/−673 region of mγGCShc promoter was examined by ChIP using the primers shown in B and indicated Abs. Amplification of mGAPDH promoter and chromatin immunoprecipitated by rabbit IgG were used as negative controls, and input DNA (2%) as an internal control. (D, G) Nuclear NF-κB DNA binding to mγGCShc promoter-specific probes containing wild-type NF-κB binding site (WT-mγGCShc probe) (D, G) or mutant NF-κB binding site (Mut-mγGCShc probe) (D) was determined via EMSA. OCT-1 DNA binding activity was used as internal control. (E) DNA binding of different NF-κB complexes to WT-mγGCShc probe was determined via supershift analysis using rabbit IgG (Control Ab) or Abs specific for indicated NF-κB subunits. (F) NF-κB-mediated regulation of mγGCShc promoter activity was determined by reporter assay. NIH3T3 cells were co-transfected with Renilla luciferase vector (pRL-CMV) and firefly luciferase reporter plasmid containing mγGCShc promoter with wild-type (p987-luc) or mutant (Mut p987-luc) NF-κB binding site. In addition, all co-transfections contained pEGFP-C1 empty vector or pEGFP-p65 and/or pEGFP-IκBαΔN. Twenty-four hours later, firefly and Renilla luciferase activities in cell lysates were measured. The data represent the fold induction of firefly/Renilla luciferase activity ratio relative to pEGFP-C1-transfected cells. Data are representative of three independent experiments. *p<0.001 versus NIH3T3+p987-luc+pEGFP-C1 and p<0.001 versus NIH3T3+p987-luc+pEGFP-p65 (Student's t test). Error bars indicate mean ± SD.

References

    1. Lira R, Sundar S, Makharia A, Kenney R, Gam A, et al. Evidence that the high incidence of treatment failures in Indian kala-azar is due to the emergence of antimony-resistant strains of Leishmania donovani. J Infect Dis. 1999;180:564–567. - PubMed
    1. Croft SL, Sundar S, Fairlamb AH. Drug resistance in leishmaniasis. Clin Microbiol Rev. 2006;19:111–126. - PMC - PubMed
    1. Ashutosh, Sundar S, Goyal N. Molecular mechanisms of antimony resistance in Leishmania. J Med Microbiol. 2007;56:143–153. - PubMed
    1. Carter KC, Hutchison S, Henriquez FL, Legare D, Ouellette M, et al. Resistance of Leishmania donovani to sodium stibogluconate is related to the expression of host and parasite gamma-glutamylcysteine synthetase. Antimicrob Agents Chemother. 2006;50:88–95. - PMC - PubMed
    1. Mukherjee A, Padmanabhan PK, Singh S, Roy G, Girard I, et al. Role of ABC transporter MRPA, gamma-glutamylcysteine synthetase and ornithine decarboxylase in natural antimony-resistant isolates of Leishmania donovani. J Antimicrob Chemother. 2007;59:204–211. - PubMed

Publication types

MeSH terms