

Combining ChIP-chip and expression profiling to model the MoCRZ1 mediated circuit for Ca/calcineurin signaling in the rice blast fungus
- PMID: 20502632
- PMCID: PMC2873923
- DOI: 10.1371/journal.ppat.1000909
Combining ChIP-chip and expression profiling to model the MoCRZ1 mediated circuit for Ca/calcineurin signaling in the rice blast fungus
Abstract
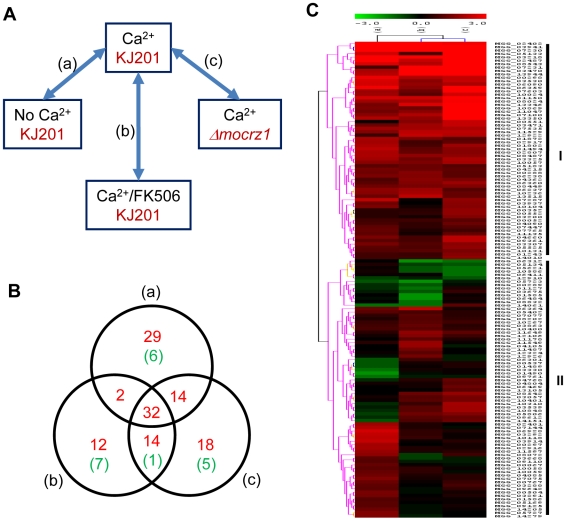
Significant progress has been made in defining the central signaling networks in many organisms, but collectively we know little about the downstream targets of these networks and the genes they regulate. To reconstruct the regulatory circuit of calcineurin signal transduction via MoCRZ1, a Magnaporthe oryzae C2H2 transcription factor activated by calcineurin dephosphorylation, we used a combined approach of chromatin immunoprecipitation - chip (ChIP-chip), coupled with microarray expression studies. One hundred forty genes were identified as being both a direct target of MoCRZ1 and having expression concurrently differentially regulated in a calcium/calcineurin/MoCRZ1 dependent manner. Highly represented were genes involved in calcium signaling, small molecule transport, ion homeostasis, cell wall synthesis/maintenance, and fungal virulence. Of particular note, genes involved in vesicle mediated secretion necessary for establishing host associations, were also found. MoCRZ1 itself was a target, suggesting a previously unreported autoregulation control point. The data also implicated a previously unreported feedback regulation mechanism of calcineurin activity. We propose that calcium/calcineurin regulated signal transduction circuits controlling development and pathogenicity manifest through multiple layers of regulation. We present results from the ChIP-chip and expression analysis along with a refined model of calcium/calcineurin signaling in this important plant pathogen.
Conflict of interest statement
The authors have declared that no competing interests exist.
Figures


Similar articles
-
MoCRZ1, a gene encoding a calcineurin-responsive transcription factor, regulates fungal growth and pathogenicity of Magnaporthe oryzae.Fungal Genet Biol. 2009 Mar;46(3):243-54. doi: 10.1016/j.fgb.2008.11.010. Epub 2008 Dec 10. Fungal Genet Biol. 2009. PMID: 19111943
-
The application of ChIP-chip analysis in the rice blast pathogen.Methods Mol Biol. 2011;722:121-31. doi: 10.1007/978-1-61779-040-9_8. Methods Mol Biol. 2011. PMID: 21590416
-
MoSnt2-dependent deacetylation of histone H3 mediates MoTor-dependent autophagy and plant infection by the rice blast fungus Magnaporthe oryzae.Autophagy. 2018;14(9):1543-1561. doi: 10.1080/15548627.2018.1458171. Epub 2018 Aug 31. Autophagy. 2018. PMID: 29929416 Free PMC article.
-
The Role of Cell Wall Degrading Enzymes in Pathogenesis of Magnaporthe oryzae.Curr Protein Pept Sci. 2017;18(10):1019-1034. doi: 10.2174/1389203717666160813164955. Curr Protein Pept Sci. 2017. PMID: 27526928 Review.
-
Moving toward a systems biology approach to the study of fungal pathogenesis in the rice blast fungus Magnaporthe grisea.Adv Appl Microbiol. 2005;57:177-215. doi: 10.1016/S0065-2164(05)57006-0. Adv Appl Microbiol. 2005. PMID: 16002013 Review. No abstract available.
Cited by
-
Convergent Evolution of Calcineurin Pathway Roles in Thermotolerance and Virulence in Candida glabrata.G3 (Bethesda). 2012 Jun;2(6):675-91. doi: 10.1534/g3.112.002279. Epub 2012 Jun 1. G3 (Bethesda). 2012. PMID: 22690377 Free PMC article.
-
Calcineurin orchestrates dimorphic transitions, antifungal drug responses and host-pathogen interactions of the pathogenic mucoralean fungus Mucor circinelloides.Mol Microbiol. 2015 Sep;97(5):844-65. doi: 10.1111/mmi.13071. Epub 2015 Jun 17. Mol Microbiol. 2015. PMID: 26010100 Free PMC article.
-
Transcription factor control of virulence in phytopathogenic fungi.Mol Plant Pathol. 2021 Jul;22(7):858-881. doi: 10.1111/mpp.13056. Epub 2021 May 11. Mol Plant Pathol. 2021. PMID: 33973705 Free PMC article. Review.
-
SREBP coordinates iron and ergosterol homeostasis to mediate triazole drug and hypoxia responses in the human fungal pathogen Aspergillus fumigatus.PLoS Genet. 2011 Dec;7(12):e1002374. doi: 10.1371/journal.pgen.1002374. Epub 2011 Dec 1. PLoS Genet. 2011. PMID: 22144905 Free PMC article.
-
Hyphopodium-Specific VdNoxB/VdPls1-Dependent ROS-Ca2+ Signaling Is Required for Plant Infection by Verticillium dahliae.PLoS Pathog. 2016 Jul 27;12(7):e1005793. doi: 10.1371/journal.ppat.1005793. eCollection 2016 Jul. PLoS Pathog. 2016. PMID: 27463643 Free PMC article.
References
-
- Ebbole DJ. Magnaporthe as a model for understanding host-pathogen interactions. Annu Rev Phytopathol. 2007;45:437–456. - PubMed
-
- Wilson RA, Talbot NJ. Under pressure: investigating the biology of plant infection by Magnaporthe oryzae. Nat Rev Microbiol. 2009;7:185–195. - PubMed
-
- Xu JR, Zhao X, Dean RA. From genes to genomes: a new paradigm for studying fungal pathogenesis in Magnaporthe oryzae. Adv Genet. 2007;57:175–218. - PubMed
-
- Choi J, Kim Y, Kim S, Park J, Lee YH. MoCRZ1, a gene encoding a calcineurin-responsive transcription factor, regulates fungal growth and pathogenicity of Magnaporthe oryzae. Fungal Genet Biol. 2009;46:243–254. - PubMed
Publication types
MeSH terms
Substances
LinkOut - more resources
Full Text Sources
Molecular Biology Databases
Research Materials
