. 2010 May 19;5(5):e10706.
doi: 10.1371/journal.pone.0010706.

Differentiating embryonic stem cells pass through 'temporal windows' that mark responsiveness to exogenous and paracrine mesendoderm inducing signals

Affiliations

Differentiating embryonic stem cells pass through 'temporal windows' that mark responsiveness to exogenous and paracrine mesendoderm inducing signals

Steven A Jackson et al. PLoS One. .

Abstract

Background: Mesendoderm induction during embryonic stem cell (ESC) differentiation in vitro is stimulated by the Transforming Growth Factor and Wingless (Wnt) families of growth factors.

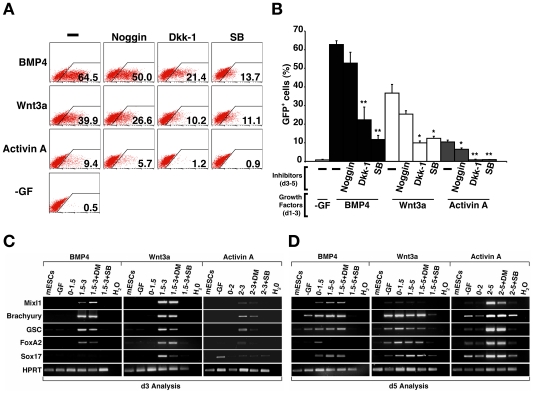
Principal findings: We identified the periods during which Bone Morphogenetic Protein (BMP) 4, Wnt3a or Activin A were able to induce expression of the mesendoderm marker, Mixl1, in differentiating mouse ESCs. BMP4 and Wnt3a were required between differentiation day (d) 1.5 and 3 to most effectively induce Mixl1, whilst Activin A induced Mixl1 expression in ESC when added between d2 and d4, indicating a subtle difference in the requirement for Activin receptor signalling in this process. Stimulation of ESCs with these factors at earlier or later times resulted in little Mixl1 induction, suggesting that the differentiating ESCs passed through 'temporal windows' in which they sequentially gained and lost competence to respond to each growth factor. Inhibition of either Activin or Wnt signalling blocked Mixl1 induction by any of the three mesendoderm-inducing factors. Mixing experiments in which chimeric EBs were formed between growth factor-treated and untreated ESCs revealed that BMP, Activin and Wnt signalling all contributed to the propagation of paracrine mesendoderm inducing signals between adjacent cells. Finally, we demonstrated that the differentiating cells passed through 'exit gates' after which point they were no longer dependent on signalling from inducing molecules for Mixl1 expression.

Conclusions: These studies suggest that differentiating ESCs are directed by an interconnected network of growth factors similar to those present in early embryos and that the timing of growth factor activity is critical for mesendoderm induction.


Conflict of interest statement

Competing Interests: The authors have declared that no competing interests exist.

Figures

Figure 1
Figure 1. Mesendoderm inducing activity of BMP4 is restricted to a specific temporal window during ESC differentiation.
(A) Flow cytometric analysis of d5 Mixl1 GFP/w ESCs differentiated in cultures supplemented with 10 ng/ml BMP4 for 24 h with the time of initial growth factor addition to the culture staggered at daily intervals starting at d0 (upper panels) or day 0.5 (lower panels). The proportion of GFP+ cells in this experiment is shown in the lower right of each plot. Flow cytometry profiles from no growth factor (-GF) control cultures are shown to the left of each series. (B) Histograms summarising flow cytometry data from three independent experiments, showing the average percentage of GFP+ cells at d5 observed for each period of BMP4 addition. (mean±sd, n = 3).
Figure 2
Figure 2. Mesendoderm inducing activities of BMP4, Wnt3a and Activin A are restricted to specific temporal windows during ESC differentiation.
(A) Flow cytometry analysis at d5 of a representative experiment of Mixl1 GFP/w ESCs differentiated in cultures supplemented with 10 ng/ml BMP4, 100 ng/ml Wnt3a or 100 ng/ml Activin A for the indicated time intervals (measured in days after initiation of differentiation). The proportion of GFP+ cells is shown in the lower right of each plot. The flow cytometry profiles from no growth factor (-GF) control cultures are shown to the left of each series. (B) Histogram summarising flow cytometry data measuring the proportion of GFP+ cells at d5 in EBs treated with Wnt3a or Activin A during the time intervals indicated (days) (mean±sd, n = 3). (C) Brightfield and epifluorescence images of differentiating EBs. The growth factors and period of addition are indicated to the left of each row and day of differentiation when the image was taken in the top right hand corner of each panel. (Original magnification×100).
Figure 3
Figure 3. Induction of maximal proportions of GFP+ Mixl1GFP/w cells requires signalling via BMP, Wnt and Activin receptor pathways.
(A) Flow cytometry analysis at d5 of a representative experiment of Mixl1 GFP/w ESCs differentiated in cultures supplemented with BMP4 (d1–d5), Wnt3a (d1–d5) or Activin A (d2–d5) alone or in the presence of the signalling pathway inhibitors noggin, Dkk-1 or SB 431542. Growth factors are shown to the left of each row and inhibitors are shown at the top of each column. Flow cytometry profiles obtained from control cells with no growth factor added (-GF) are shown in the bottom left panel. The percentage of GFP+ positive cells is recorded in the bottom right corner of each plot. (B) Histogram summarising flow cytometry data measuring the proportion of GFP+ cells at d5 in EBs treated with BMP4, Wnt3a or Activin A with and without inhibitors. (mean±sd, n = 3) (* p<0.05, ** p<0.01 compared to cells not receiving inhibitor). SB; SB 431542. (C) Semi-quantitative RT-PCR analysis of growth factor gene expression in cells from d3 cultures stimulated with BMP4 (d1–d3), Wnt3a (d1–d3) or Activin A (d2–d3). The samples are indicated at the top of each column and the growth factor genes analysed on the left of each row. ESC; undifferentiated ESCs, -GF; no growth factor, Act A; Activin A, H2O; no template control. (D) Real time PCR analysis of BMP4, Wnt3 and nodal gene expression at d3 in ESCs differentiated in the presence of BMP4 (d1.5–d3), Wnt3a (d1.5–d3) and Activin A (d2–d3). (mean±sem, n = 3). (* p<0.05, ** p<0.01 compared to samples collected from cells differentiated in the absence of growth factor.)
Figure 4
Figure 4. ES Cells differentiated in response to BMP4 or Wnt3a generate paracrine signals that induce GFP in Mixl1 GFP/w EBs.
(A) Method used to assess the ability of ‘stimulator’ wild type Mixl1 w/w ESCs differentiated in the presence of growth factors to induce expression of GFP in ‘responder’ Mixl1 GFP/w ESCs differentiated in absence of exogenous growth factors. After 3d of differentiation, both ‘stimulator’ and ‘responder’ EBs were disaggregated and chimeric spin EBs formed by re-aggregating ‘stimulator’ and ‘responder’ cells in a 1∶1 ratio. After allowing differentiation to proceed for a further 2d in the absence of growth factors the chimeric EBs were harvested for analysis. (B) Flow cytometry analysis of d5 chimeric EBs. The growth factors used for the ‘stimulator’ and ‘responder’ cultures for the initial 3d of differentiation are shown above each panel of a representative experiment (stimulator/responder). All ‘responder’ differentiations were performed in the absence of added growth factors (/-GF). The flow cytometry profiles obtained using ‘stimulator’ cells not exposed to growth factor (-GF/-GF) are shown as a negative control. The percentage of GFP+ cells is shown. (C) Histogram summarising the flow cytometry data at d5 (mean ±sd, n = 3). (D) Flow cytometry analysis of d5 chimeric EBs formed by aggregating growth factor stimulated wild type Mixl1 w/w with unstimulated Mixl1 GFP/w differentiating ESCs at d3. At the time of aggregation, inhibitors of BMP (noggin), canonical Wnt (Dkk-1) and Activin receptor (SB 431542) signalling were added to the cultures. Growth factors used to stimulate the wild type ESCs from d0–d3 are shown to the left of each row. Inhibitors are shown at the top of each column. Flow cytometry profiles obtained with cells from the no growth factor (-GF) control cultures are shown. The percentage of GFP+ positive cells is recorded in the bottom right corner of each plot. SB; SB 431542.
Figure 5
Figure 5. BMP4, Wnt and Activin signalling are required after d3 for maximal GFP induction from Mixl1 GFP/w EBs.
(A) Flow cytometry analysis of GFP expression in d5 Mixl1 GFP/w EBs stimulated with BMP4 (d1–3), Wnt3a (d1–3) or Activin A (d2–3) and subsequently treated from d3–5 with the inhibitors noggin, Dkk-1 or SB 431542. SB; SB 431542. (B) Histogram summarising d5 flow cytometry data (mean±sd, n = 3) (* p<0.05, ** p<0.01 compared to cells not receiving inhibitor). SB; SB 431542. (C, D) Gene expression analysis of (C) d3 and (D) d5 differentiating mESCs treated with exogenous BMP4, Wnt3a and Activin A. The growth factor and treatment days are indicated across the top of each sample. Samples to which the Activin signalling inhibitor SB 431542 was added are indicated (SB), as are control samples that were treated with DMSO carrier (DM). The genes analysed are shown on the left hand side of each row.
Figure 6
Figure 6. Wnt3a and Activin A synergise to induce GFP in Mixl1 GFP/w EBs.
(A) Flow cytometry analysis at d5 of a representative experiment of Mixl1 GFP/w ESCs differentiated in cultures supplemented with 100 ng/ml Wnt3a (W) and/or 100 ng/ml Activin A (A) from the time indicated. The no growth factor (-GF) control is shown to the left. (B) Histogram summarising the d5 flow cytometry data from Mixl1 GFP/w ESCs differentiated in cultures supplemented with the indicated growth factors from the time indicated. (mean±sd, n = 3) (* p<0.05 compared to d3A). B; BMP4, W; Wnt3a, A; Activin A.
Figure 7
Figure 7. Induction of Mixl1 expression is regulated through the integration of signals from BMP, Wnt and Activin/nodal pathways.
(A) Interactions between signalling pathways and inhibitors impacting upon Mixl1 induction. BMP4 stimulates expression of Wnt and Activin/nodal, which in turn induce Mixl1, perhaps acting through as yet unidentified intermediate molecules. The time periods (in days) and differentiation stages during which the differentiating ES cells are responsive to each stimulus are indicated. Probable autocrine (A) and paracrine (P) roles of the factors are indicated. (B) Removal of factors maintaining pluripotency enables ES cells to differentiate and to respond to BMP4, Wnt3a or Activin A signals delivered during a defined ‘temporal window’ for mesendoderm induction. (C) After cells pass through the mesendoderm window at d3, they then pass through ‘exit gates’ for each signalling pathway, after which time they are no longer dependent on that pathway for mesendoderm induction. In response to BMP4 addition between d1.5 and d3, the approximate percentage of cells that have passed the BMP4, Wnt3a or Activin A ‘exit gates’ at d3 is shown. See text for more details (Data taken from Figure 5B).

Similar articles

Cited by

References

    1. Keller GM. In vitro differentiation of embryonic stem cells. Curr Opin Cell Biol. 1995;7:862–869. - PubMed
    1. Hirst CE, Ng ES, Azzola L, Voss AK, Thomas T, et al. Transcriptional profiling of mouse and human ES cells identifies SLAIN1, a novel stem cell gene. Dev Biol. 2006;293:90–103. - PubMed
    1. Gadue P, Huber TL, Nostro MC, Kattman S, Keller GM. Germ layer induction from embryonic stem cells. Exp Hematol. 2005;33:955–964. - PubMed
    1. Smith J, Wardle F, Loose M, Stanley E, Patient R. Germ Layer Induction in ESC - Following the Vertebrate Roadmap. Current Protocols in Stem Cell Biology 1 2007 - PubMed
    1. Tam PP, Loebel DA, Tanaka SS. Building the mouse gastrula: signals, asymmetry and lineages. Curr Opin Genet Dev. 2006;16:419–425. - PubMed

Publication types

MeSH terms