

An integrative model for phytochrome B mediated photomorphogenesis: from protein dynamics to physiology
- PMID: 20502669
- PMCID: PMC2873432
- DOI: 10.1371/journal.pone.0010721
An integrative model for phytochrome B mediated photomorphogenesis: from protein dynamics to physiology
Erratum in
- PLoS One. 2010;5(6). doi: 10.1371/annotation/4563eaf4-e45b-4d9e-ab06-5f1794bf11e3
Abstract
Background: Plants have evolved various sophisticated mechanisms to respond and adapt to changes of abiotic factors in their natural environment. Light is one of the most important abiotic environmental factors and it regulates plant growth and development throughout their entire life cycle. To monitor the intensity and spectral composition of the ambient light environment, plants have evolved multiple photoreceptors, including the red/far-red light-sensing phytochromes.
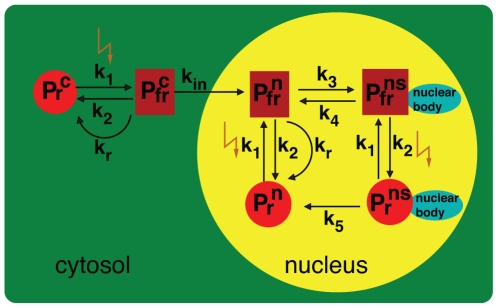
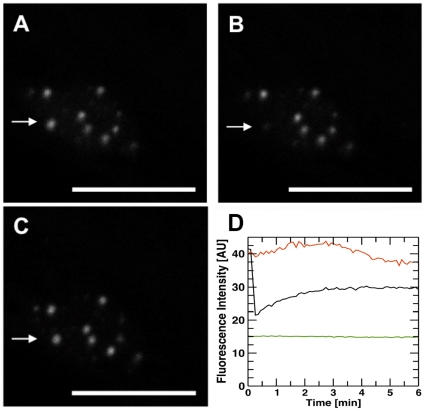
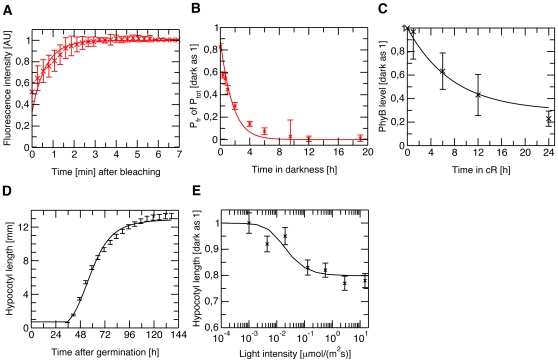
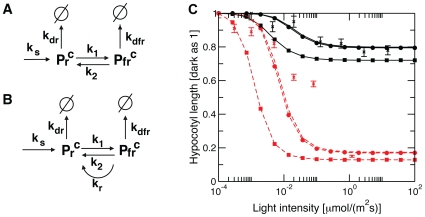
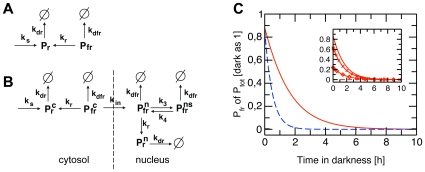
Methodology/principal findings: We have developed an integrative mathematical model that describes how phytochrome B (phyB), an essential receptor in Arabidopsis thaliana, controls growth. Our model is based on a multiscale approach and connects the mesoscopic intracellular phyB protein dynamics to the macroscopic growth phenotype. To establish reliable and relevant parameters for the model phyB regulated growth we measured: accumulation and degradation, dark reversion kinetics and the dynamic behavior of different nuclear phyB pools using in vivo spectroscopy, western blotting and Fluorescence Recovery After Photobleaching (FRAP) technique, respectively.
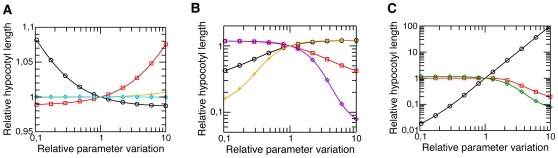
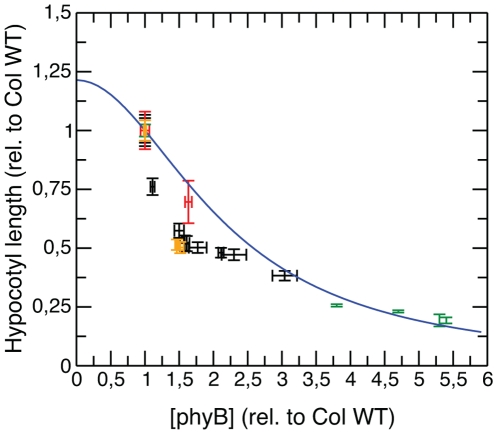
Conclusions/significance: The newly developed model predicts that the phyB-containing nuclear bodies (NBs) (i) serve as storage sites for phyB and (ii) control prolonged dark reversion kinetics as well as partial reversibility of phyB Pfr in extended darkness. The predictive power of this mathematical model is further validated by the fact that we are able to formalize a basic photobiological observation, namely that in light-grown seedlings hypocotyl length depends on the total amount of phyB. In addition, we demonstrate that our theoretical predictions are in excellent agreement with quantitative data concerning phyB levels and the corresponding hypocotyl lengths. Hence, we conclude that the integrative model suggested in this study captures the main features of phyB-mediated photomorphogenesis in Arabidopsis.
Conflict of interest statement
Figures

Similar articles
-
The basic helix-loop-helix transcription factor PIF5 acts on ethylene biosynthesis and phytochrome signaling by distinct mechanisms.Plant Cell. 2007 Dec;19(12):3915-29. doi: 10.1105/tpc.107.051508. Epub 2007 Dec 7. Plant Cell. 2007. PMID: 18065691 Free PMC article.
-
Arabidopsis phytochrome B promotes SPA1 nuclear accumulation to repress photomorphogenesis under far-red light.Plant Cell. 2013 Jan;25(1):115-33. doi: 10.1105/tpc.112.107086. Epub 2013 Jan 31. Plant Cell. 2013. PMID: 23371951 Free PMC article.
-
Synergistic and Antagonistic Action of Phytochrome (Phy) A and PhyB during Seedling De-Etiolation in Arabidopsis thaliana.Int J Mol Sci. 2015 May 28;16(6):12199-212. doi: 10.3390/ijms160612199. Int J Mol Sci. 2015. PMID: 26030677 Free PMC article.
-
Phytochrome B phosphorylation expanded: site-specific kinases are identified.New Phytol. 2024 Jan;241(1):65-72. doi: 10.1111/nph.19314. Epub 2023 Oct 9. New Phytol. 2024. PMID: 37814506 Review.
-
Phytochrome B photobody components.New Phytol. 2024 May;242(3):909-915. doi: 10.1111/nph.19675. Epub 2024 Mar 13. New Phytol. 2024. PMID: 38477037 Review.
Cited by
-
Genomic analysis of circadian clock-, light-, and growth-correlated genes reveals PHYTOCHROME-INTERACTING FACTOR5 as a modulator of auxin signaling in Arabidopsis.Plant Physiol. 2011 May;156(1):357-72. doi: 10.1104/pp.111.172684. Epub 2011 Mar 23. Plant Physiol. 2011. PMID: 21430186 Free PMC article.
-
Increasing ambient temperature progressively disassembles Arabidopsis phytochrome B from individual photobodies with distinct thermostabilities.Nat Commun. 2020 Apr 3;11(1):1660. doi: 10.1038/s41467-020-15526-z. Nat Commun. 2020. PMID: 32245953 Free PMC article.
-
RcaE-Dependent Regulation of Carboxysome Structural Proteins Has a Central Role in Environmental Determination of Carboxysome Morphology and Abundance in Fremyella diplosiphon.mSphere. 2018 Jan 24;3(1):e00617-17. doi: 10.1128/mSphere.00617-17. eCollection 2018 Jan-Feb. mSphere. 2018. PMID: 29404416 Free PMC article.
-
What is going on inside of phytochrome B photobodies?Plant Cell. 2024 May 29;36(6):2065-2085. doi: 10.1093/plcell/koae084. Plant Cell. 2024. PMID: 38511271 Free PMC article. Review.
-
Phase separation and molecular ordering of the prion-like domain of the Arabidopsis thermosensory protein EARLY FLOWERING 3.Proc Natl Acad Sci U S A. 2023 Jul 11;120(28):e2304714120. doi: 10.1073/pnas.2304714120. Epub 2023 Jul 3. Proc Natl Acad Sci U S A. 2023. PMID: 37399408 Free PMC article.
References
-
- Chen M, Chory J, Fankhauser C. Light signal transduction in higher plants. Annu Rev Genet. 2004;38:87–177. - PubMed
-
- Ulm R. UV-B perception and signalling in higher plants. In: Schäfer E, Nagy F, editors. Photomorphogenesis in plants and bacteria: function and signal transduction mechanisms, Ed 3. Springer Verlag; 2006. pp. 279–299.
-
- Cashmore AR. Cryptochromes. In: Schäfer E, Nagy F, editors. Photomorphogenesis in plants and bacteria: function and signal transduction mechanisms, Ed 3. Springer Verlag; 2006. pp. 199–218.
-
- Briggs WB, Christie JM, Swartz TE. Phototropines. In: Schäfer E, Nagy F, editors. Photomorphogenesis in plants and bacteria: function and signal transduction mechanisms, Ed 3. Springer Verlag; 2006. pp. 223–247.
-
- Schäfer E, Nagy F. Physiological basis of photomorphogenesis. In: Schäfer E, Nagy E, editors. Photomorphogenesis in plants and bacteria: function and signal transduction mechanisms, Ed 3. Springer Verlag; 2006. pp. 13–22.
Publication types
MeSH terms
Substances
Grants and funding
LinkOut - more resources
Full Text Sources
Molecular Biology Databases
Research Materials
Miscellaneous
