. 2010 Dec;32(4):467-81.
doi: 10.1007/s11357-010-9150-z. Epub 2010 May 26.

The hydrogen sulfide signaling system: changes during aging and the benefits of caloric restriction

Affiliations

The hydrogen sulfide signaling system: changes during aging and the benefits of caloric restriction

Benjamin L Predmore et al. Age (Dordr). 2010 Dec.

Abstract

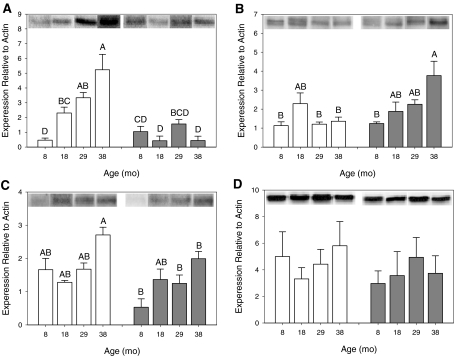
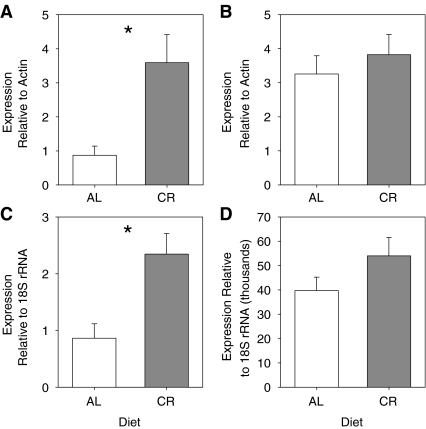
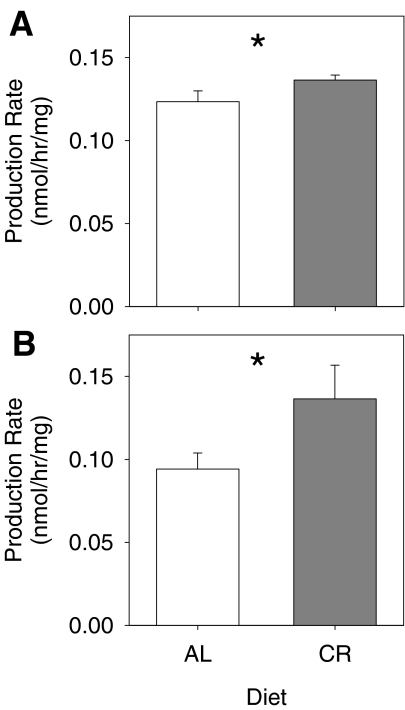
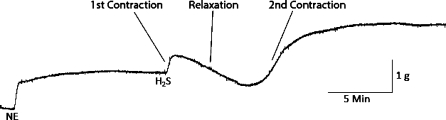
Hydrogen sulfide gas (H(2)S) is a putative signaling molecule that causes diverse effects in mammalian tissues including relaxation of blood vessels and regulation of perfusion in the liver, but the effects of aging on H(2)S signaling are unknown. Aging has negative impacts on the cardiovascular system. However, the liver is more resilient with age. Caloric restriction (CR) attenuates affects of age in many tissues. We hypothesized that the H(2)S signaling system is negatively affected by age in the vasculature but not in the liver, which is typically more resilient to age, and that a CR diet minimizes the age affect in the vasculature. To investigate this, we determined protein and mRNA expression of the H(2)S-producing enzymes cystathionine γ-lyase (CSE) and cystathionine β-synthase (CBS), H(2)S production rates in the aorta and liver, and the contractile response of aortic rings to exogenous H(2)S. Tissue was collected from Fisher 344 × Brown Norway rats from 8-38 months of age, which had been maintained on an ad libitum (AL) or CR diet. The results demonstrate that age and diet have differential effects on the H(2)S signaling system in aorta and liver. The aorta showed a sizeable effect of both age and diet, whereas the liver only showed a sizeable effect of diet. Aortic rings showed increased contractile sensitivity to H(2)S and increased protein expression of CSE and CBS with age, consistent with a decrease in H(2)S concentration with age. CR appears to benefit CSE and CBS protein in both aorta and liver, potentially by reducing oxidative stress and ameliorating the negative effect of age on H(2)S concentration. Therefore, CR may help maintain the H(2)S signaling system during aging.


Figures

Fig. 1
Fig. 1
Effect of age and diet on CSE and CBS protein expression. CSE expression is shown in aorta (a, n = 3–5 per group) and liver (b, n = 3 per group). CBS expression is shown in aorta (c, n = 3–4 per group) and liver (d, n = 3 per group). The y-axis shows CSE (a and b) or CBS (c and d) protein expression relative to β-actin. The x-axis shows the age in months (mo). AL data are in white columns and CR data are in grey columns. Representative blots are aligned along the top, above each column. Data are represented as mean ± SE and were analyzed by 2-way ANOVA with Tukey's post-hoc tests. Means that do not share a common letter are significantly different
Fig. 2
Fig. 2
Effect of diet on CSE and CBS mRNA expression. CSE expression is shown in aorta (a, n = 13 AL, n = 12 CR) and liver (b, n = 12 per group). CBS expression is shown in aorta (c, n = 12 AL, n = 11 CR) and liver (d, n = 12 per group). The y-axis shows CSE (a and b) protein expression relative to β-actin and CBS (c and d) protein expression relative to 18S rRNA. The x-axis shows the diet. AL data are in white columns and CR data are in grey columns. Data are represented as mean ± SE and were analyzed by one-tailed or pooled t tests. Means that are significantly different are indicated by asterisks
Fig. 3
Fig. 3
Effect of diet on H2S production. H2S production rates are shown in aorta (a, n = 17 AL, n = 21 CR) and liver (b, n = 12 per group). The y-axis shows production as nmol H2S/h/mg protein. The x-axis shows the diet. AL data are in white columns and CR data are in grey columns. Data are represented as mean ± SE and were analyzed by one-tailed t tests. Means that are significantly different are indicated by asterisks
Fig. 4
Fig. 4
Representative tension tracing of a rat aorta ring pre-contracted with norepinephrine (NE) and exposed to H2S (H2S, 300 µmol/L). Scale bar shows time in minutes and tension in grams
Fig. 5
Fig. 5
Effect of age the first-phase contraction and second-phase relaxation to 100 µM H2S. The first-phase contraction (a, n = 12, 15, and 14, from 14–34 month, respectively) and second phase relaxation (b, n = 12, 15, and 14, from 14–34 month, respectively) to H2S significantly increase in magnitude with age at 100 µmol/L H2S addition. The y-axis represents the H2S-induced tension of aortic rings (grams per milligram) pooled from both diets. The x-axis shows the age (month). Data are presented as means ± SE (a) or as box plots showing the median as a horizontal line, the box covering the 25th and 50th percentiles, and error bars defining the 10th and 90th percentiles (b). Data were analyzed by one-way ANOVA with Tukey's post-hoc test (a) or a Kruskal–Wallis ANOVA with a Wilcoxon's t test for post-hoc comparison (b). Means that do not share a common letter are significantly different
Fig. 6
Fig. 6
Effect of diet on KCl-and norepinephrine (NE)-induced contractions. CR causes an increase in contraction magnitude in response to KCl (a, n = 41) and NE (b, n = 41). The y-axis represents the KCl- or NE-induced tension of aortic rings (grams per milligram) pooled from all ages. The x-axis represents age diet: ad libitum (AL) or caloric restricted (CR). AL data are in white columns and CR data are in grey columns. Data are represented as mean ± SE and were analyzed by one-tailed t tests. Means that are significantly different are indicated by asterisks
Fig. 7
Fig. 7
Effect of diet on H2S-induced contractions. CR causes an increase in contraction magnitude in response to H2S in the first-phase contraction (a, n = 18 AL, n = 23 CR), second-phase relaxation (b, n = 18 AL, n = 23 CR) and third-phase contraction (c, n = 18 AL, n = 23 CR). The y-axis represents the H2S-induced tension of aortic rings (grams per milligram) pooled from all ages. The x-axis represents H2S concentration. Columns show diet for ad libitum (AL, white) or caloric restricted (CR, grey) animals at each concentration tested. Data are presented as box plots showing the median as a horizontal line, the box covering the 25th and 50th percentiles, and error bars defining the 10th and 90th percentiles. Data were analyzed by one-tailed t test, pooled t test, or Wilcoxon's test. Medians that are significantly different are indicated by asterisks

References

    1. Abe K, Kimura H. The possible role of hydrogen sulfide as an endogenous neuromodulator. J Neurosci. 1996;16(3):1066–1071. - PMC - PubMed
    1. Ali MY, Ping CY, Mok YY, Ling L, Whiteman M, Bhatia M, Moore PK. Regulation of vascular nitric oxide in vitro and in vivo; a new role for endogenous hydrogen sulphide? Br J Pharmacol. 2006;146:625–634. doi: 10.1038/sj.bjp.0706906. - DOI - PMC - PubMed
    1. Anantharaju A, Feller A, Chedid A. Aging liver. A review. Gerontology. 2002;48(6):343–353. doi: 10.1159/000065506. - DOI - PubMed
    1. Anderson RM, Weindruch R. Metabolic reprogramming, caloric restriction and aging. Trends Endocrinol Metab. 2010;21(3):134–141. doi: 10.1016/j.tem.2009.11.005. - DOI - PMC - PubMed
    1. Aspnes LE, Lee CM, Weindruch R, Chung SS, Roecker EB, Aiken JM. Caloric restriction reduces fiber loss and mitochondrial abnormalities in aged rat muscle. FASEB J. 1997;11(7):573–581. - PubMed

Publication types

MeSH terms