. 2010 Jul;28(7):1250-9.
doi: 10.1002/stem.450.

Cell cycle heterogeneity in the small intestinal crypt and maintenance of genome integrity

Affiliations

Cell cycle heterogeneity in the small intestinal crypt and maintenance of genome integrity

Steven C Pruitt et al. Stem Cells. 2010 Jul.

Abstract

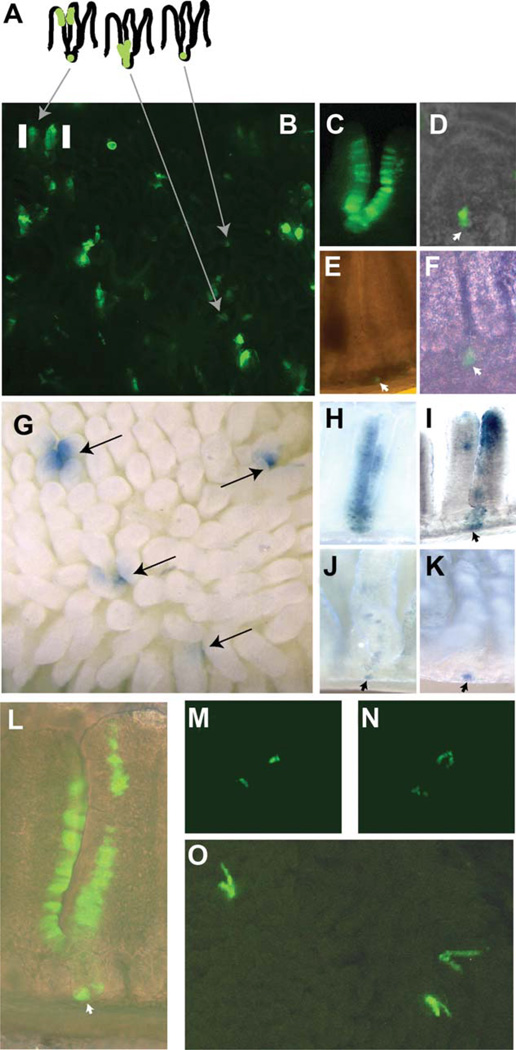
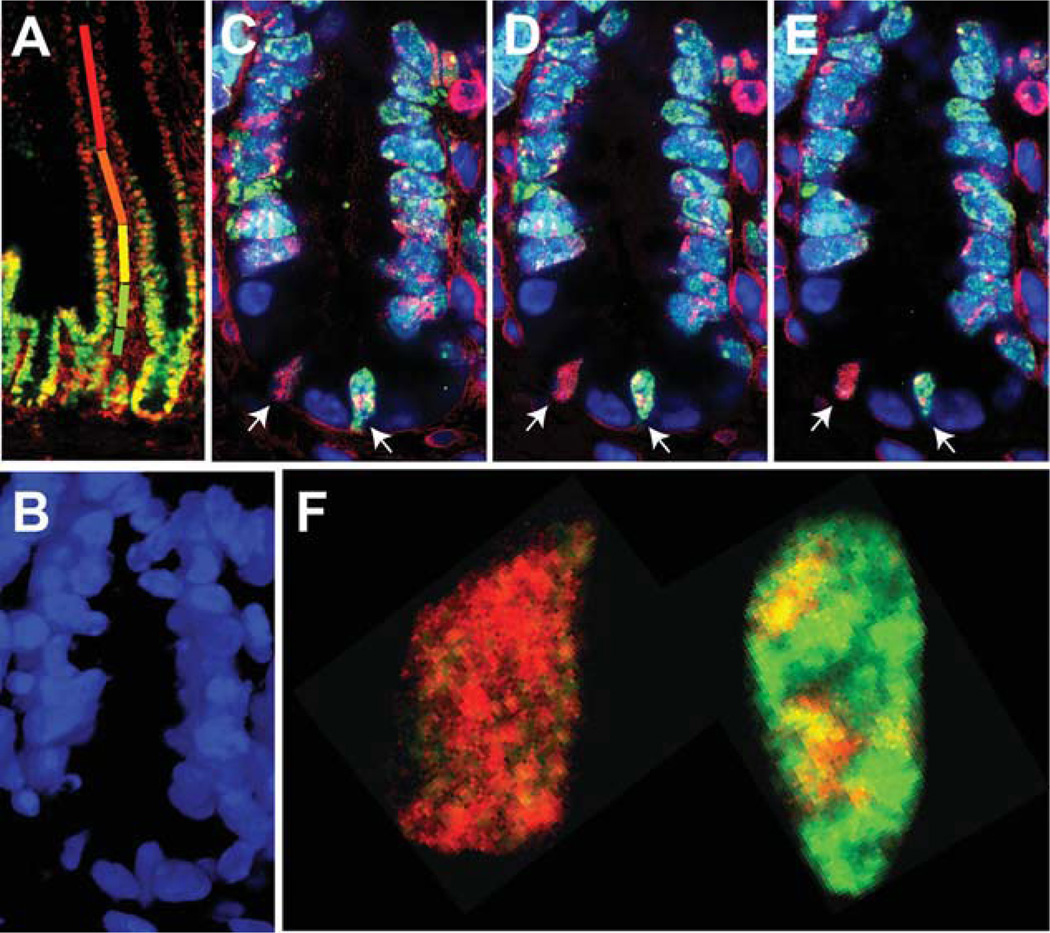
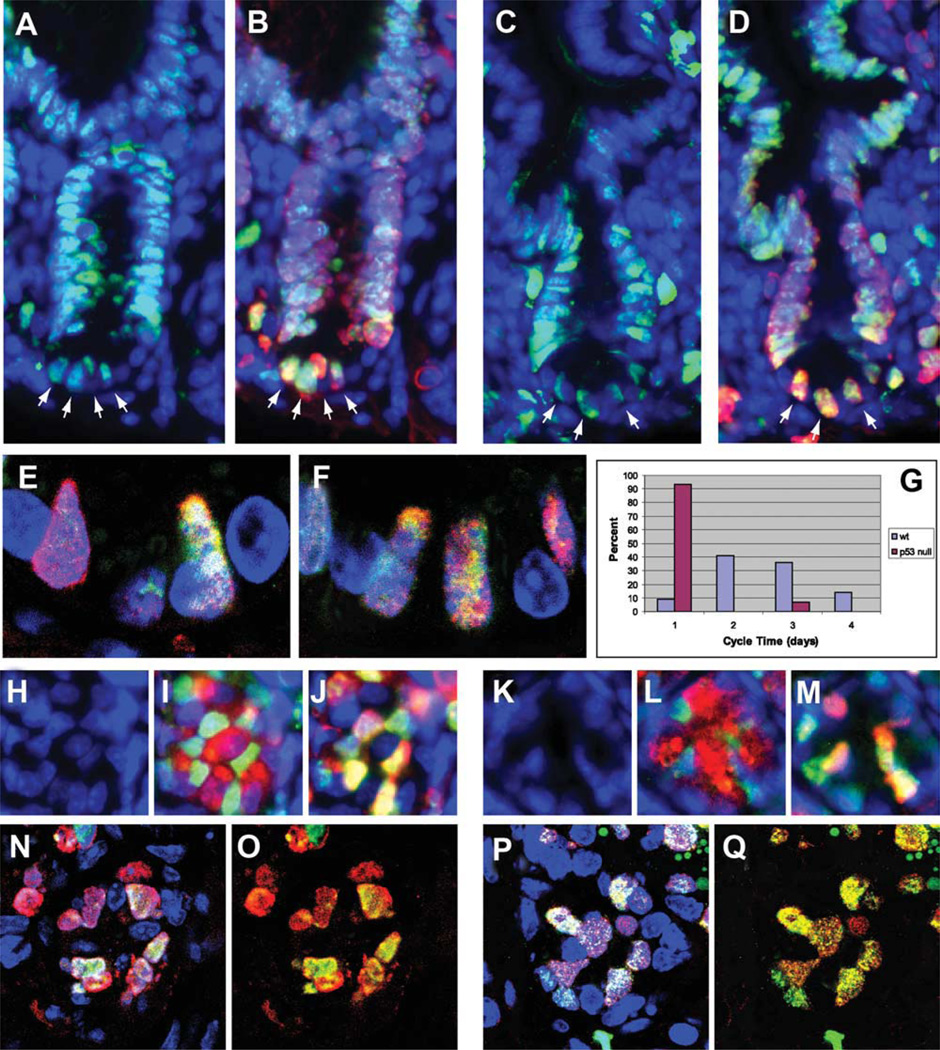
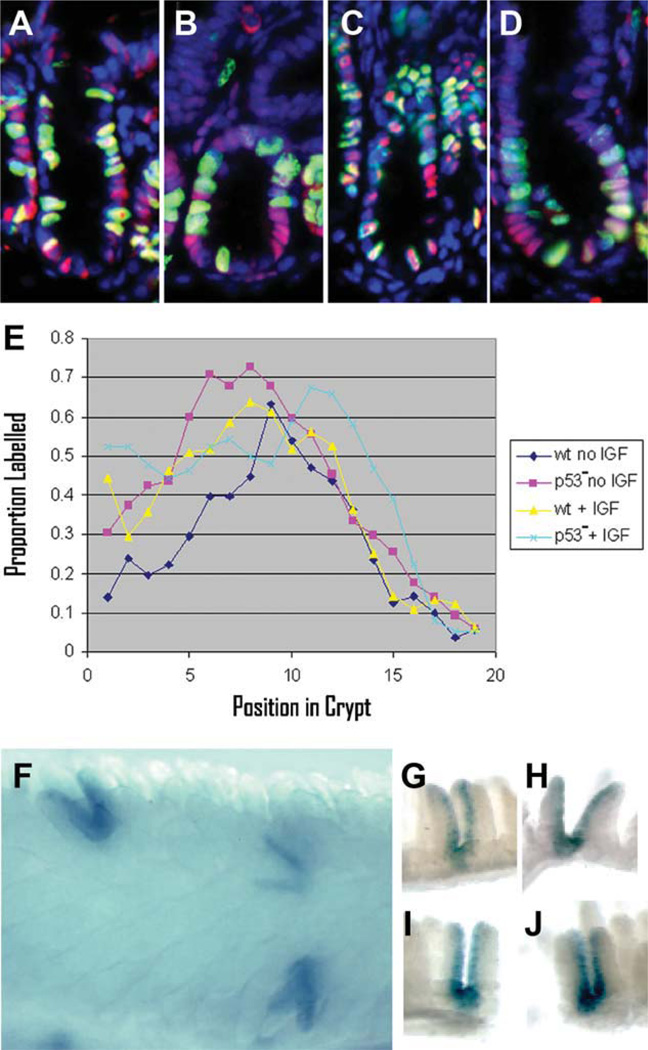
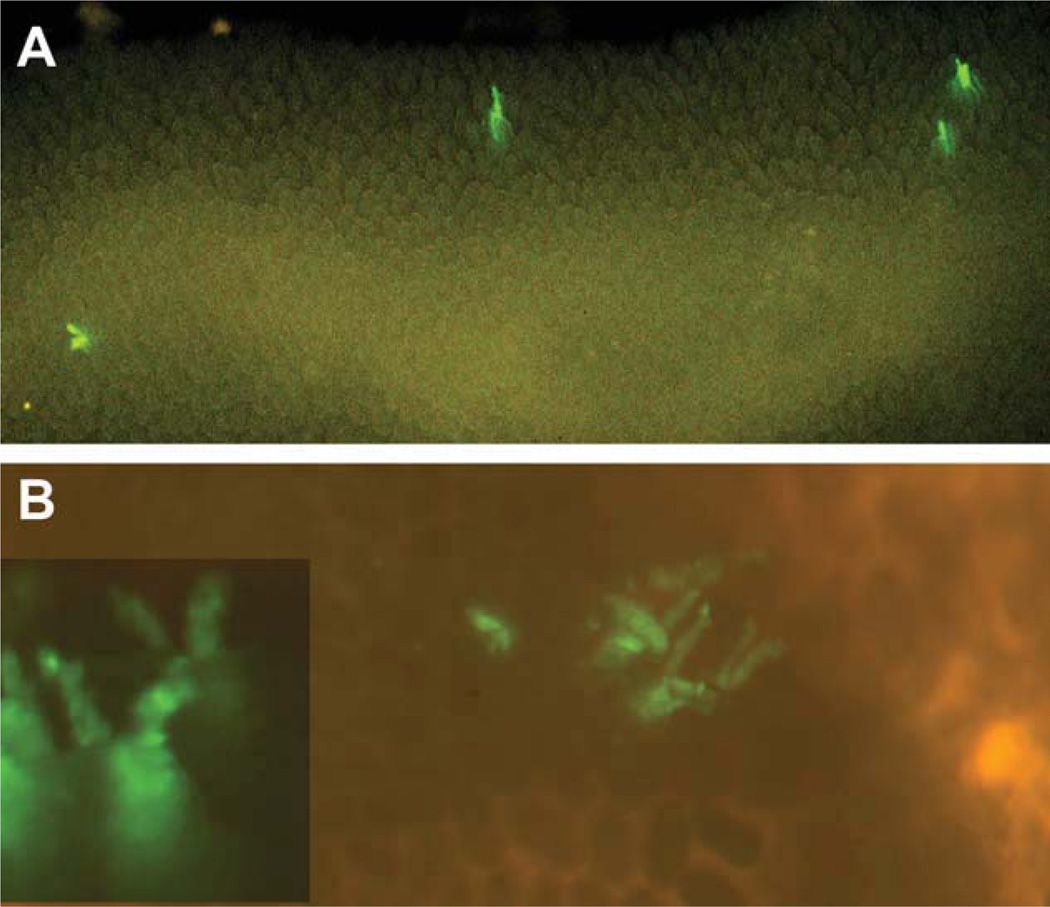
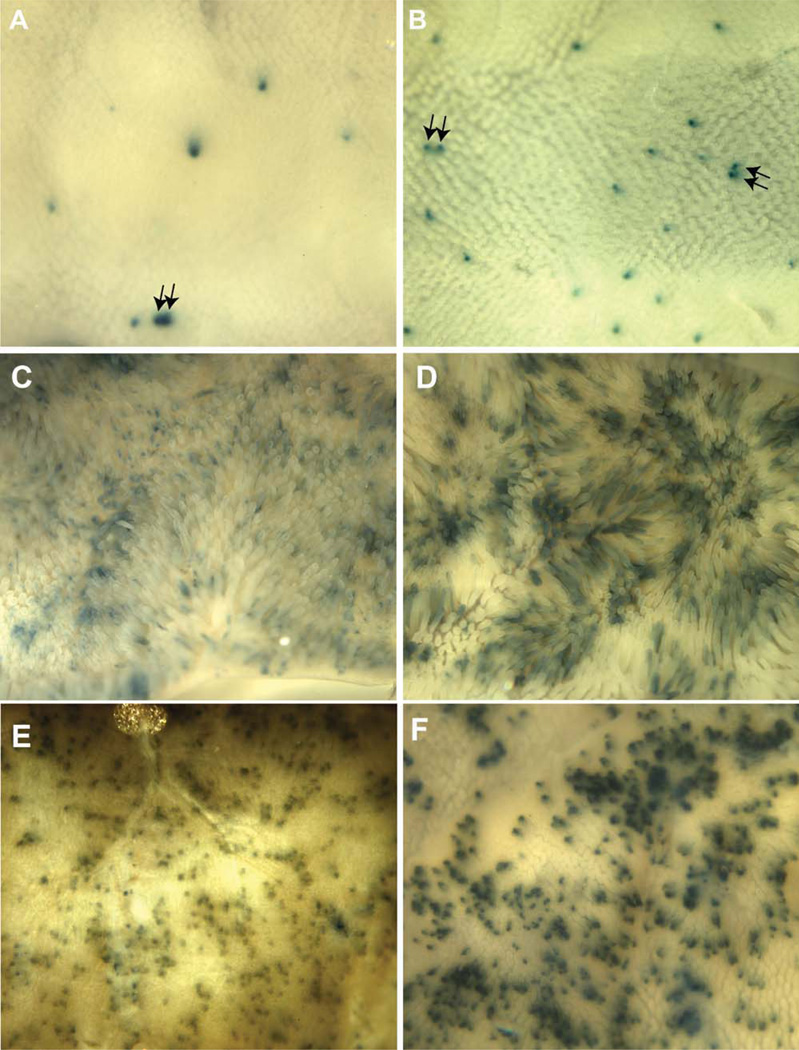
Stem cell quiescence has been hypothesized to suppress the rate at which genetic mutations accumulate within tissues by reducing the number of divisions a cell undergoes. However, recent studies have suggested that stem cells in the small intestine are rapidly dividing. This observation raises the issue of whether replication related errors are an important contributor to the accumulation of genetic damage and, if so, how genomic integrity is maintained within the small intestine. Here, reporter-marked small intestinal epithelial cells, resulting from mini-chromosome maintenance protein 2 (Mcm2) gene driven Cre-mediated recombination, are shown to be retained at the +1 position within the crypt and to contribute to the intestinal epithelia over long periods. Additionally, we show that the rate of cycling of +1 position Mcm2-expressing stem cells is heterogeneous with cycling times ranging between 1 and 4 days. Further, this heterogeneity depends on the p53 signaling pathway and could provide the basis for retention and expansion, through niche succession and crypt fission, of genetically intact stem cells. This somatic selection process would require active cellular replication.


Conflict of interest statement

Disclosure of Potential Conflicts of Interest

S.C.P. the founder and owner of the Buffalo Molecular Target Labs. LLC. The other authors have no financial interests to disclose.

Figures

Figure 1
Figure 1
Mcm2-CreERT2-induced reporter expression profiles in small intestine. The schematic in panel (A) represents an interpretation of various enhanced green fluorescent protein (EGFP)-marked clusters of cells in panel (B) which is an image of EGFP fluorescence in a living explant of the small intestine of an Mcm2Cre-ERT2;Tg(ACTB-Bgeo/GFP)21Lbe (commonly referred to as Z/EG) mouse at approximately 1 month following treatment with tamoxifen. Panels (C–F) are images of EGFP expressing cells in individual crypts and associated villi at between 1 and 3 months following tamoxifen treatment and prepared by mild formalin fixation and manual dissection. Panel (G) is an image of the small intestine from an Mcm2Cre-ERT2;R26R mouse at approximately 10 weeks following tamoxifen treatment and stained for β-galactosidase activity. Panels (H–K) show images of β-galactosidase stained cells in individual crypts and associated villi following manual dissection. Panel (L) shows a manually dissected crypt containing EGFP expressing cells at 10 months following tamoxifen treatment. Panels (M, N) show regions of EGFP expression in living explants immediately following isolation [panel (M)] or after 12 hours in culture [panel (N)] where the same location is shown. Panel (O) is an image of the small intestine of an Mcm2Cre-ERT2;Z/EG mouse at approximately 1 month following treatment with tamoxifen where during the final 3 days prior to isolation the mouse received daily injections of insulin-like growth factor 1 (IGF1). The images in panels (B, C, E, M, N, O) were taken using a fluorescence dissecting stereomicroscope at magnifications between ×20 and ×40. The images in panels (G–K) were taken using a dissecting stereomicroscope and bright-field illumination at magnifications between ×20 and ×40. The images in panels (D, F, L) were taken using an inverted fluorescence microscope at magnifications ranging between ×40 and ×200. Additional images of the crypt shown in panel (D) are presented in the Supporting Information, Section 1, Figure S2.
Figure 2
Figure 2
Five-step ratiometric labeling to define days on which replication occurred for most cells within the small intestinal crypt. A wild-type 129/Sv mouse was administered drinking water containing varying ratios of IdU and CldU as follows: d1, 100% IdU, d2, 75% IdU:25% CldU, d3, 50% IdU:50% CldU; d4, 25% IdU:75% CldU; and d5, 100% CldU. Following labeling, 7-µm thick paraffin sections were prepared of the small intestine and assayed for incorporation of IdU and CldU using methods described previously [10]. A low magnification image taken at ×40 magnification using a compound fluorescence microscope is shown in panel (A). Different colored bars represent the different color transitions between nuclei near the tips of the villi, which are red, and become progressively more green at positions closer to the crypt. Within the crypts, however, nuclei appear more yellow, suggesting a continued presence of IdU, which would result from more slowly dividing cells. Examination of crypts using confocal microscopy at ×680 magnification and optical sectioning at intervals of 0.5 µm is shown in panels (B–E), where panel (B) is a three-dimensional reconstruction of DAPI stained nuclei over 6.0 µm and panels (C–E) are adjacent optical sections from within this interval stained for IdU (red) and CldU (green). There are two nuclei with the morphology of crypt basal columnar cells within the basal portion of this crypt each of which has incorporated IdU and CldU. Further, subdomains within the nucleus on the right which exhibit differing ratios of CldU:IdU are identifiable. Contiguous domains of three different hues can be identified in each of the three serial sections in this nucleus. These observations are consistent with this nucleus having undergone DNA synthesis on three or four different days during which different ratios of IdU to CldU were incorporated. In contrast, the nucleus on the left exhibits a predominant orange color domain demonstrating the presence of DNA synthesized on day 2 of the experiment and suggesting that this cells has remained quiescent for a period of at least 4 days (however, see Supporting Information, Section 2). Panel (F) shows a higher magnification of one optical section from each of these nuclei.
Figure 3
Figure 3
Use of ratiometric labeling to estimate cycle times of +1 position Mcm2+ cells in wild-type and p53 null mice. Four step ratiometric labeling was utilized in wt and p53 null mice where mice received 100% CldU on day 1, 67% CldU:33% IdU on day 2, 33% CldU:67% IdU on day 3, and 100% IdU on day 4. Images are from 7-µm paraffin sections where longitudinal sections are shown in panels (A–F) and transverse sections are shown in panels (H–Q). Images in panels (A–D) were taken at ×200 magnification using a compound fluorescence microscope. Panels (A) and (B) are images from wild-type mice stained for Mcm2 (green) and DAPI (blue) in panel (A) and IdU (red), CldU (green), and DAPI (blue) in panel (B). Panels (C, D) are images from p53 null mice stained for stained for Mcm2 (green) and DAPI (blue) in panel (C) and IdU (red), CldU (green) and DAPI (blue) in panel (D). Images in panels (E, F) are 0.5-um optical sections taken at ×680 magnification using confocal microscopy. Panel (E) is from a wild-type mouse stained for IdU (red), CldU (green) and DAPI (blue). Panel (F) is from a p53 null mouse stained for IdU (red), CldU (green) and DAPI (blue). Panel (G) is a plot of the minimal estimated interval between cell divisions of +1 position Mcm2+ cells determined for each of 56 nuclei from wt mice (blue bars) and 30 nuclei from p53 null mice (red bars) as determined from the largest and, if present, second largest color domains present in ratiometrically labeled sections stained for IdU and CldU. The percent of the nuclei showing cycling intervals ranging between 1 and 4 days are plotted. Images in panels (H–M) are from transverse sections taken at ×200 magnification using a compound fluorescence microscope and show individual crypts from wt (panels [H–J]) and p53 null mice. Panels (H, K) show DAPI stained nuclei (blue); panels (I, J) show staining for Mcm2 (green), lysozyme (red), and DAPI (blue); and panels (J, M) show staining for IdU (red), CldU (green), and DAPI (blue). Images in panels (N–Q) are 0.5-um thick optical sections taken in the transverse plane by confocal microscopy where panels (N, O) are from a wt mouse crypt and panels (P, Q) are from a p53 null mouse crypt. In these panels staining is for DAPI (blue), IdU (red), and CldU (green).
Figure 4
Figure 4
Pulse labeling and Mcm2-CreERT2-mediated marking studies confirm an increased rate of cycling in the stem cells of p53 null mice relative to wild type. In panels (A–E) wt or p53 null mice were treated with daily IGF1 injections for 3 days and compared to mice of the same genotypes that had not been treated with IGF1. A pulse of CldU was given 2 hours prior to harvesting the small intestine. Panels (A–D) show 7-µm-thick longitudinal paraffin sections stained for Mcm2 (red), CldU (green), and DAPI (blue) where panel (A) is wt, no IGF1; panel (B) is p53 null, no IGF1; panel (C) is wt, IGF1 treated; and panel (D) is p53 null, IGF1 treated. Panel (E) shows of the proportion of Mcm2 stained nuclei that are also stained for CldU (y-axis) plotted as a function of position of the nuclei from the base of the crypt (x-axis) from 50 or more crypts for each of the different experimental conditions as indicated in the box. Panel (F) is a bright-field image of a whole mount preparation of small intestine stained for β-galactosidase activity from a p53 null, Mcm2-CreERT2 mouse carrying a Cre-dependent lacZ reporter at approximately 1 month following tamoxifen treatment. Panels (G–J) are individual β-galactosidase expressing crypts prepared by microdissection. Abbreviation: IGF, insulin-like growth factor 1.
Figure 5
Figure 5
EGFP expression profiles in small intestine of Mcm2-CreERT2:Z/EG mice at approximately 10 months following tamoxifen treatment. Panel (A) is an image taken using a fluorescence dissecting microscope at approximately ×20 magnification of EGFP fluorescence in scattered individual crypts of living explant from the small intestine of an Mcm2Cre-ERT2;Z/EG mouse at approximately 10 months following treatment with tamoxifen. Panel (B) shows an image taken at approximately ×30 magnification of clusters of EGFP fluorescence-marked crypts which are also found in these mice at approximately 10 months following tamoxifen treatment, where the inset in this figure is a higher magnification of a similar cluster.
Figure 6
Figure 6
Distribution of Mcm2-CreERT2-marked β-galactosidase expressing crypts in the ileum and duodenum of wt and p53 null mice. Wild-type and p53 null mice carrying the Mcm2-CreERT2 and R26R transgenes were treated with tamoxifen and 10 weeks following tamoxifen treatment small intestine was recovered, fixed, and stained for β-galactosidase activity. Panels (A, B) are images taken from the outside of the ileum to facilitate identification of stained crypts and these and similar images were used to identify adjacent-marked crypts (arrows in panels [A, B]) as discussed in the text. Panels (C–F) are similar preparations from the duodenum where (C) and (D) are images taken from the inside to show villi and (E) and (F) are images taken from the outside to show the distribution of marked crypts. All images were taken under bright-field illumination at a magnification of approximately ×12.5.

References

    1. Cairns J. Mutation selection and the natural history of cancer. Nature. 1975;255:197–200. - PubMed
    1. Barker N, van Es JH, Kuipers J, et al. Identification of stem cells in small intestine and colon by marker gene Lgr5. Nature. 2007;449:1003–1007. - PubMed
    1. Bjerknes M, Cheng H. Clonal analysis of mouse intestinal epithelial progenitors. Gastroenterology. 1999;116:7–14. - PubMed
    1. Bjerknes M, Cheng H. Multipotential stem cells in adult mouse gastric epithelium. Am J Physiol Gastrointest Liver Physiol. 2002;283:G767–G777. - PubMed
    1. Barker N, van de Wetering M, Clevers H. The intestinal stem cell. Genes Dev. 2008;22:1856–1864. - PMC - PubMed

Publication types

Substances