. 2010 Jun;239(6):1585-95.
doi: 10.1002/dvdy.22316.

Developmental atlas of the early first trimester human embryo

Affiliations

Developmental atlas of the early first trimester human embryo

Shigehito Yamada et al. Dev Dyn. 2010 Jun.

Abstract

Rapid advances in medical imaging are facilitating the clinical assessment of first-trimester human embryos at increasingly earlier stages. To obtain data on early human development, we used magnetic resonance (MR) imaging and episcopic fluorescence capture (EFIC) to acquire digital images of human embryos spanning the time of dynamic tissue remodeling and organogenesis (Carnegie stages 13 to 23). These imaging data sets are readily resectioned digitally in arbitrary planes, suitable for rapid high-resolution three-dimensional (3D) observation. Using these imaging datasets, a web-accessible digital Human Embryo Atlas (http://apps.devbio.pitt.edu/humanatlas/) was created containing serial 2D images of human embryos in three standard histological planes: sagittal, frontal, and transverse. In addition, annotations and 3D reconstructions were generated for visualizing different anatomical structures. Overall, this Human Embryo Atlas is a unique resource that provides morphologic data of human developmental anatomy that can accelerate basic research investigations into developmental mechanisms that underlie human congenital anomalies.


Figures
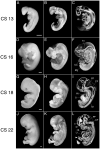
Figure 1
Figure 1. MR microscopy of human embryos at different developmental stages
Human embryos at CS13, CS16, CS18 and CS22 were imaged by MR microscopy. Photographs of the human embryos are shown in (A, D, G, J). 3D reconstructions of the same embryos using MR images are shown in (B, E, H, K), and 2D MR images in the sagittal plane are shown in (C, F, I, L). At CS13 (A–C), limb buds are present, and the prosencephalon (P), mesencephalon (M) and rhombencephalon (R) with the rhombomeric ridges can be seen. Also notable is the looped heart tube (C). At CS16 (D–F), the eye primordia and upper and lower limb buds with limb paddles are observed (panel E). In the abdominal cavity, the midgut (Mg) is invested in the umbilical cord (UC) (panel F). At CS18 (G–I), anlagen for the digits are evident in the forelimb (panels G, H). In the thoracic cavity, the heart (Ht) and the lung are clearly seen (panel I). In the brain, the infundibulum and Rathke’s pouch, precursors of the hypophysis are evident (arrowhead in panel I). At CS22, craniofacial and eye development have advanced considerably, and the digits in the fore and hindlimbs are well developed (panel L). At this stage, most of the abdominal cavity is occupied by the liver (Li), and physiological midgut herniation is present (arrowhead in panel L). Bars = 1 mm. CF: cervical flexure, D: diencephalon, PF: pontine flexure, T: telencephalon, Tn: tongue.
Figure 2
Figure 2. Development of the brain in human embryos
MR images of human embryos are shown as 3D volumes (A–D) and in 2D views (E–H) to illustrate development of the brain. At CS13 (A, E), the optic cup (Op) is seen as a prominent outpocketing from the diencephalic region of the prosencephalon (P). A 2D image in a transverse plane show the optic cup (Op) and the otic vesicle (Ot). The craniopharyngeal pouch (arrowhead in panel E) is in contact with the floor of the diencephalic region of the prosencephalon. Near the otic vesicle, the otic ganglion (OG) can be seen. At CS16 (B, F), connection of the optic cup to the prosencephalon by the optic stalk (arrowhead) can be seen. In the area of 4th ventricle (4thV), the rhombomeres and median sulcus of the 4th ventricle (arrow) are clearly observable. At CS19 (C, G), the cerebral hemispheres enlarge and the pontine flexure (arrow) is prominent (panel C). In the 2D section image (panel G), the lateral ventricles (LtV) and the 3rd ventricle (3rdV) are clearly seen. The trigeminal ganglia (TG) are prominent. The junction of the vertebral arteries (arrow), the basilar artery, and the anterior inferior cerebellar artery (arrowhead) branching from the basilar artery can be seen at the center of this section. The cochlea (Co) is developing posterior to the trigeminal ganglion. The anterior inferior cerebellar arteries (arrowhead in G) are branching from the basilar artery downstream of the junction of bilateral vertebral arteries (arrow in G). By CS22 (D, H), the cerebral hemispheres have greatly enlarged and elongated posteriorly (D). In the 2D section image (H), the cerebral cortex around the lateral ventricles (LtV) has thickened considerably. The adenohypophysis is observed with the dorsum sellae (DS) just below the hypothalamus (Hp). The lumen of the internal jugular vein (IJV) is seen as a low-intensity lumen. Bars = 1mm.
Figure 3
Figure 3. MR images in different cross sectional views
MR images obtained from a CS22 embryo are shown in different cross sectional views, (A–E), with the level of each section indicated in the photograph of the embryo shown in (F). (A). An imaging plane through the lower part of the head shows the eye, external acoustic meatus (arrowhead), spinal cord (SC) and tongue (Tn). In the eye, the lens and neural retina (Re) is seen as regions of high intensity. The longus capitis muscle (LC) is also apparent. (B). An imaging plane through the upper chest. The pulmonary artery (PA) is seen connecting to the ductus arteriosus (Dc). The ascending aorta (AA), trachea (Tr), esophagus (Es), and forearm (FA) are also observed. (C). An imaging plane through the lower chest. In this section, the right ventricle (RV), left ventricle (LV) and right atrium (RA) can be seen. The trachea bifurcates into bronchi (Br), with the left bronchus going into the left lung. The esophagus and descending aorta (DA) are also observed. (D). An imaging plane through the mid-section between the thorax and abdomen. The lung (Lg) can be seen in the thoracic cavity, while the liver (Li) with the hepatic veins (HV) fills the abdominal cavity at this level. (E). The abdomen, at the level of the umbilical cord. The liver (Li), stomach (St), and adrenal glands (Ad) are seen in the abdominal cavity. In the umbilical cord (UC), the umbilical artery (UA) emerges through the abdominal wall and the midgut (Mg) herniates into the umbilical cord. Bar = 1 mm.
Figure 4
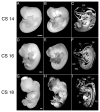
Figure 4. EFIC imaging of human embryos at CS14, 16, and 18
Human embryos at CS14 (A–C), CS16 (D–F), and CS18 (G–I) were processed for EFIC imaging. Photographs of the human embryos are shown in (A, D, G). 3D reconstructions of the same embryos using EFIC images are shown in (B, E, H), and 2D EFIC images in the sagittal plane are shown in (C, F, I). EFIC imaging provides exquisite anatomical details of the embryo, such as the endocardial cushions at the atrioventricular junction (panel C), and Rathke’s pouch (RP). In the CS16 sagittal EFIC section, the tongue (Tn), the sclerotomes (Sc), and gut are evident. At CS18, the 3D reconstructions show digits in the forming limb bud (panel H). Also observed are the pontine flexure (PF), the cervical flexure (CF), the heart (Ht), the lung (Lg), liver (Li) and stomach (St). D: diencephalon, M: mesencephalon, Mg: midgut, R: rhombencephalon, UC: umbilical cord. Bars = 1 mm.
Figure 5
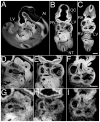
Figure 5. High resolution EFIC images in three orthogonal views
CS14 embryo was processed for EFIC imaging, with three orthogonal imaging planes obtained from digital resectioning of the image stack: A: sagittal, B: frontal, and C: transverse. The heart region is shown in magnified view in (D–F). The outflow tract is observed to emerge from the presumptive right ventricle (RV). Also seen is the right atrium (RA) and left ventricle (LV) (panel C and D–F). For comparison, MR images of the same embryo are shown in similar imaging planes at similar magnifications in panels (G–I). At: atrium, NT: neural tube, OC: optic cup. Bars = 500μm
Figure 6
Figure 6. EFIC 2D image stacks of human embryo at CS16
EFIC 2D images from different axial levels of a CS16 human embryo is shown in (A–G). The axial level of each 2D image in panels (A–G) is delineate in panel (H). In the most rostral section (A), the mesencephalon (M), rhombencephalon (R), trigeminal ganglion (TG) and vestibular pouch (VP) can be observed. Further caudally at the level of the eye (B), the floor of the diencephalon (D) and hypophyseal pouch can be seen (arrowhead). Also observed are the cochlear pouch (CP), the glossopharyngeal nerve (IX) and complex comprising the vagus and accessory (XI) nerves. At the level of the heart (C, D), the outflow tract (OFT), left and right atria (LA, RA), and right and left ventricle (RV, LV) are present. Note at the level of the ductus venosus in the abdominal cavity (E), most of the abdomen is occupied by the liver (Li). Also seen in this section are two umbilical arteries (arrowheads) and an umbilical vein (asterisk) in the umbilical cord. A section through the abdomen at the level of the stomach (St) (F) shows the mesonephros (Mn) and liver (Li) and also seen is the umbilical cord with physiological herniation of the midgut (Mg). A section through the posterior part of the abdomen shows the descending aorta (DA). The mesonephric tubules (MT) are clearly evident in panel G. Bar = 1 mm. LL: lower limb, NC: Neural canal, NP: nasal placode, PC: peritoneal cavity, PP: primitive pharynx, SG: spinal ganglion, T: telencephalon, UC: umbilical cord, UL: upper limb, UV: umbilical vein.
Figure 7
Figure 7. CS16 Embryo Imaged By MR microscopy and EFIC
A CS16 embryo was imaged by both EFIC (A–D) and MR microscopy (E–H). 3D volumes generated from the 2D image stacks obtained by EFIC and MR microscopy are shown in (A) and (E), while sagittal 2D slices in similar views obtained by EFIC and MR microscopy are shown in (B–D) and (F–H), respectively. In both sets of images, detailed anatomy of the developing organ systems can be observed including the central nervous system, atrium (At), right ventricle (RV), left ventricle (LV), and outflow tract of the heart. The EFIC images are more refined and provide much clearer definition of the primordia of the adenohypophysis, the hypophyseal pouch (arrow in B, C). Bar = 1mm M: metencephalon, Mg: midgut, R: rhombencephalon, St: stomach, T: telencephalon, UC: umbilical cord.
Figure 8
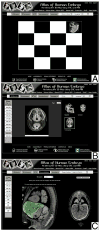
Figure 8. Atlas of the Human Embryo
A web based Human Embryo Atlas has been constructed using digital images obtained from MR microscopy and EFIC imaging of human embryos from CS13 to CS23. The top panel shows the home page of the Human Embryo Atlas website (A). For each developmental stage, 2D stacks of MR microscopy images in three orthogonal planes are available for viewing as QuickTime movies. This is shown in the middle panel, where a transverse section of a CS22 embryo has been selected for viewing (B). There are two drop-down lists that can change the imaging modality (MRI or EFIC) and allow selection of the datasets for viewing (Whole body, Brain, and Heart). In addition, the Atlas contains selected annotations of key anatomic structures in different organ systems that can be selected for viewing from a drop-down list, such as cardiovascular or nervous system. When the pointer is moved over the image, the selected structure is highlighted. In the window shown in the bottom panel, the liver is selected and highlighted in green (C).
Figure 9
Figure 9. Enlarged views of EFIC and MR images showing different anatomic structures in the developing human embryo
EFIC (A–E) and MR (F) images were enlarged to show different anatomic structures in the human embryo. In a CS16 embryo (A), branching of the bronchi into each lobe can be seen (arrowhead). At CS20 (B), the pulmonary artery (arrowhead) can be seen to enter the lung at the hilus. At CS18 (C–E), the gonad (arrow) and metanephros (arrowhead) and hindgut (Hg) can be seen in panel (C). A sagittal section at the diaphragmatic area (D) shows the stomach (St), the adrenal gland (arrowhead) and the gonad (arrow). A 3D reconstructed view (E), in which the liver has been digitally removed, allows visualization of the adrenal gland (arrow) under the embryonic lung and just anterior of the vertebrae (Vr). In a sagittal view of a CS22 embryo (F), the kidney (arrowhead) can be detected at the retroperitoneal area, and the adrenal gland (arrow) is seen just above the kidney. AAo: ascending aorta, Br: left bronchus, DAo: descending aorta, Es: esophagus, LA: left atrium, LV: left ventricle, MD: mesonephric duct, MN: metanephros, Or: oral cavity, Pl: pleural cavity, Rb: rib, Tr: trachea.

References

    1. Aiton JF, McDonough A, McLachlan JC, Smart SD, Whiten SC. World Wide Web access to the British Universities Human Embryo Database. J Anat. 1997;190 ( Pt 1):149–154. - PMC - PubMed
    1. Arroyo-Jimenez Mdel M, Marcos P, Martinez-Marcos A, Artacho-Perula E, Blaizot X, Munoz M, Alfonso-Roca MT, Insausti R. Gross anatomy dissections and self-directed learning in medicine. Clin Anat. 2005;18:385–391. - PubMed
    1. Baldock RA, Bard JB, Burger A, Burton N, Christiansen J, Feng G, Hill B, Houghton D, Kaufman M, Rao J, Sharpe J, Ross A, Stevenson P, Venkataraman S, Waterhouse A, Yang Y, Davidson DR. EMAP and EMAGE: a framework for understanding spatially organized data. Neuroinformatics. 2003;1:309–325. - PubMed
    1. Bone SN, Johnson GA, Thompson MB. Three-dimensional magnetic resonance microscopy of the developing chick embryo. Invest Radiol. 1986;21:782–787. - PubMed
    1. Born G. Die Plattenmodelliermethode. Arch Mikr Anat. 1883;22:584–599.

Publication types

LinkOut - more resources