. 2010 Jun;239(6):1664-73.
doi: 10.1002/dvdy.22303.

Neuropilin-1 interacts with the second branchial arch microenvironment to mediate chick neural crest cell dynamics

Affiliations

Neuropilin-1 interacts with the second branchial arch microenvironment to mediate chick neural crest cell dynamics

Rebecca McLennan et al. Dev Dyn. 2010 Jun.

Abstract

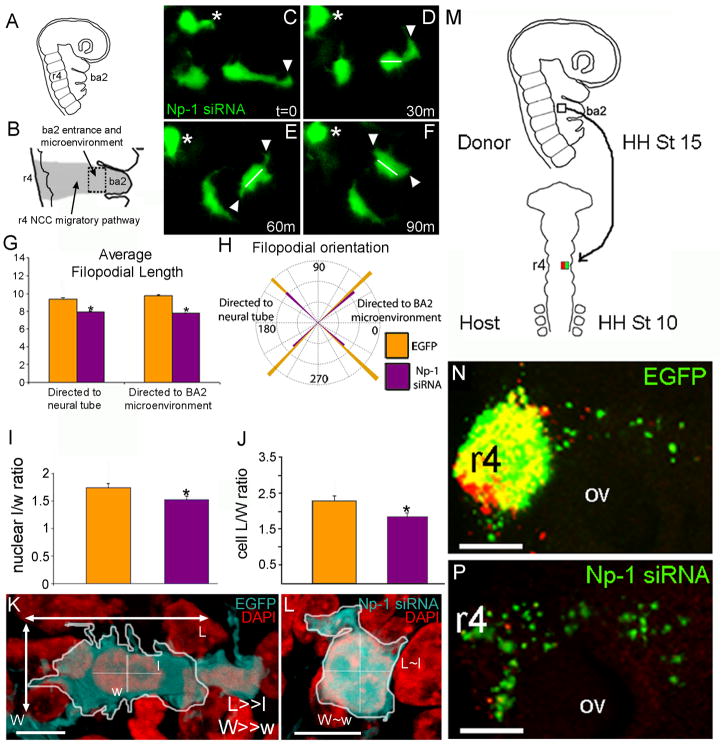
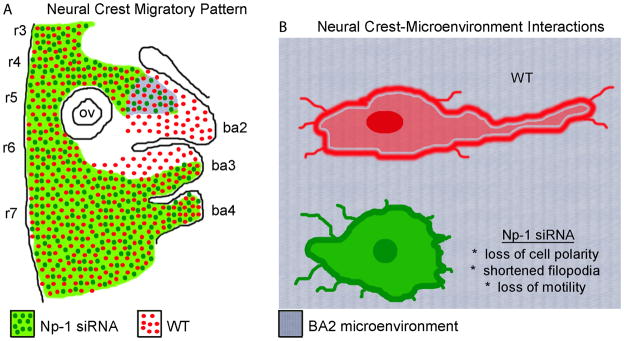
Cranial neural crest cells (NCCs) require neuropilin signaling to reach and invade the branchial arches. Here, we use an in vivo chick model to investigate whether the neuropilin-1 knockdown phenotype is specific to the second branchial arch (ba2), changes in NCC behaviors and phenotypic consequences, and whether neuropilins work together to facilitate entry into and invasion of ba2. We find that cranial NCCs with reduced neuropilin-1 expression displayed shorter protrusions and decreased cell body and nuclear length-to-width ratios characteristic of a loss in polarity and motility, after specific interaction with ba2. Directed NCC migration was rescued by transplantation of transfected NCCs into rhombomere 4 of younger hosts. Lastly, reduction of neuropilin-2 expression by shRNA either solely or with reduction of neuropilin-1 expression did not lead to a stronger head phenotype. Thus, NCCs, independent of rhombomere origin, require neuropilin-1, but not neuropilin-2 to maintain polarity and directed migration into ba2.


Figures

Figure 1
Figure 1. r7 NCCs transfected with Np-1 siRNA fail to be invasive when transplanted directly into the ba2 microenvironment entrance
(A) A schematic representation of the r7 to ba2 transplantation technique and how the quantitative measurements were calculated. (B-C) A static confocal image of a typical host embryo, 24 hours after a subpopulation of DiI-labeled (red), EGFP-transfected (green) r7 NCCs were transplanted directly into the ba2 microenvironment entrance, n=9. Both the transfected (green) and untransfected (red) NCCs were able to migrate from the transplant site. (D-E) A static confocal image of a host embryo, 24 hours after a subpopulation of DiI-labeled (red), Np-1 siRNA-transfected (green) r7 NCCs were transplanted into the ba2 microenvironment entrance, n=11. Only untransfected NCCs (red) were able to migrate from the transplant site, into the ba2 microenvironment. (F) Quantitative analysis of the length the transfected (green) NCCs migrated from the center of the transplant site as a percentage of the length the untransfected (red) NCCs migrated from the center of the transplant site. The scale bars are 100um. The notations are r, rhombomere, ba, branchial arch, L, length from the center of the transplant, *, significantly different, p<0.05.
Figure 2
Figure 2. Np-1 siRNA transfected r4 NCCs display characteristics consistent with loss of polarity and motility, but recover directed migration after transplantation into rhombomere 4 of younger host embryos
(A, B) Schematic representation of the ba2 microenvironment showing the location of the Np-1 siRNA phenotype. (C-F) Selected images from a time-lapse imaging session. The Np-1 siRNA transfected cranial NCC (green) stopped and collapsed leading edge filopodia (asterisk, t=0–90m; arrowheads, t=0–30m), remained in the same location and displayed short, dynamic filopodia in random directions (arrows, 30m–60m). Np-1 siRNA transfected cranial NCCs did not reroute trajectories, but cell body orientation actively changed (white line, 30–90m). (G) Quantitative analysis of the average length of filopodia, n=703 EGFP filopodia, n=385 Np-1 siRNA filopodia. (H) Quantitative analysis of filopodia orientation, n=703 EGFP filopodia, n=385 Np-1 siRNA filopodia. (I-J) Quantitative analysis of the nuclear and cell L/W aspect ratios. (K) Static confocal image of a cryostat section showing typical EGFP transfected cranial NCCs stained with DAPI to calculate the cell body and nuclear aspect ratios, n=41 cranial NCCs. (L) Static confocal image of typical Np-1 siRNA transfected cranial NCC in cryostat section stained with DAPI to calculate the same ratios, n=40 cranial NCCs. (M) A schematic representation of the ba2 to r4 transplantation technique. (N) A static confocal image of a host embryo, 24 hours after a subpopulation of DiI-labeled (red), EGFP-transfected (green) migratory r4 cranial NCCs from the ba2 microenvironment entrance were transplanted heterochronically and heterotopically into r4, n=8. Both the transfected (green) and untransfected (red) cranial NCCs were able to migrate from the transplant site towards the ba2 microenvironment. (P) A static confocal image of a host embryo, 24 hours after a subpopulation of DiI-labeled (red), Np-1 siRNA-transfected (green) migratory r4 cranial NCCs from the ba2 microenvironment entrance were transplanted heterochronically and heterotopically into r4, n=10. Both the transfected (green) and non-transfected (red) cranial NCCs were able to migrate from the transplant site towards the ba2 microenvironment. The notations are r, rhombomere, ba, branchial arch, ov, otic vesicle. The scale bars are 10um in K-L, and are 50um in M-P. The notations are W, width, L, length *, significantly different, p<0.05.
Figure 3
Figure 3. R4 NCC-derived structures form appropriately even though Np-1 siRNA transfected r4 NCCs do not survive long term
(A) A cryostat section through the cranial ganglia of an EGFP transfected embryo at E4.5, stained with BEN, n=6. (B) A cryostat section through the cranial ganglia of an Np-1 siRNA transfected embryo at E4.5, stained with BEN, n=8. (C, E) A cryostat section through ba2 of an EGFP transfected embryo at E3.5, n=5 and E4.5, n=8. (D, F) A cryostat section through ba2 of an Np-1 siRNA transfected embryo at E3.5, n=6 and E4.5, n=10. (G, H) Cartilage stains of the lower jaw of E9.5 embryos. (G) EGFP, n=9. (H) Np-1 siRNA, n=4. The scale bars are 100um for A-G, 50um for H-I. The notations are ba, branchial arch, CG, cranial ganglia, Mc, Meckel’s cartilage, Cb, ceratobranchial, Bh, basihyal, Bb, basibranchial, *, electroporated side of embryo.
Figure 4
Figure 4. Knockdown of neuropilin-2 expression alone or in combination with neuropilin-1 does not show a stronger branchial arch phenotype
(A) RT-PCR demonstrated that Np-2 shRNA transfected cells had reduced neuropilin-2 expression levels. (D,E) Static confocal images of the initial migration of trunk NCCs, 18 hours after electroporation. (D) Trunk NCCs transfected with EGFP only, n=7. The NCCs have started their initial migration towards and through the rostral half somite. (E) Trunk NCCs transfected with Np-2 shRNA, n=8. NCCs have entered both the rostral and caudal half somites. (B) Static confocal image of the r4 NCC stream in which cranial NCCs were transfected with Np-2 shRNA and labeled with DiI, n=16. (F) Static confocal image of the r4 NCC stream in which cranial NCCs were transfected with Np-1 siRNA and Np-2 shRNA and labeled with DiI, n=19. (C) Quantitative measurements of the distance Np-2 shRNA transfected cranial NCCs and DiI-labeled cranial NCCs migrated from the neural tube into ba2 as a percentage of the distance from the neural tube to the distal end of ba2, and the anterior-posterior width cranial NCCs spread out in ba2 as a percentage of the total width of ba2, n=7. (G) Quantitative measurements of the distance Np-1 siRNA/Np-2 shRNA transfected cranial NCCs and DiI-labeled cranial NCCs migrated, and the anterior-posterior width cranial NCCs spread out in ba2, n=11. The scale bars are 100um. The notations are R, rostral, C, caudal, r, rhombomere, ba, branchial arch, *, significantly different, p<0.01.
Figure 5
Figure 5. A schematic representation showing the Np-1 siRNA phenotype
(A) Cranial NCCs transfected with Np-1 siRNA failed to migrate properly into ba2 and the anterior portion of ba3, however invasion of more posterior targets was unaffected. (B) A schematic representation of the cellular phenotypes of Np-1 siRNA transfected cranial NCCs at the entrance to the ba2 microenvironment. Cranial NCCs transfected with Np-1 siRNA failed to completely enter the ba2 microenvironment, lost cell polarity, collapsed filopodia. The notations are r, rhombomere, ba, branchial arch, ov, otic vesicle, WT, wildtype.

Similar articles

Cited by

References

    1. Abe M, Ruest LB, Clouthier DE. Fate of cranial neural crest cells during craniofacial development in endothelin-A receptor-deficient mice. Intl J Dev Biol. 2007;51:97–105. - PMC - PubMed
    1. Baker CV, Bronner-Fraser M. The origins of the neural crest. Part I: embryonic induction. Mech Dev. 1997;69:3–11. - PubMed
    1. Berndt JD, Clay MR, Langenberg T, Halloran MC. Rho-kinase and myosin II affect dynamic neural crest cell behaviors during epithelial to mesenchymal transition in vivo. Dev Biol. 2008;324:236–244. - PMC - PubMed
    1. Bron R, Eickholt BJ, Vermeren M, Fragale N, Cohen J. Functional knockdown of neuropilin-1 in the developing chick nervous system by siRNA hairpins phenocopies genetic ablation in the mouse. Dev Dyn. 2004;230:299–308. - PubMed
    1. Carmona-Fontaine C, Matthews HK, Kuriyama S, Moreno M, Dunn GA, Parsons M, Stern CD, Mayor R. Contact inhibition of locomotion in vivo controls neural crest directional migration. Nature. 2008;456:957–961. - PMC - PubMed

Publication types

LinkOut - more resources