. 2010 Jul 1;518(13):2405-22.
doi: 10.1002/cne.22381.

Morphology and mosaics of melanopsin-expressing retinal ganglion cell types in mice

Affiliations

Morphology and mosaics of melanopsin-expressing retinal ganglion cell types in mice

David M Berson et al. J Comp Neurol. .

Abstract

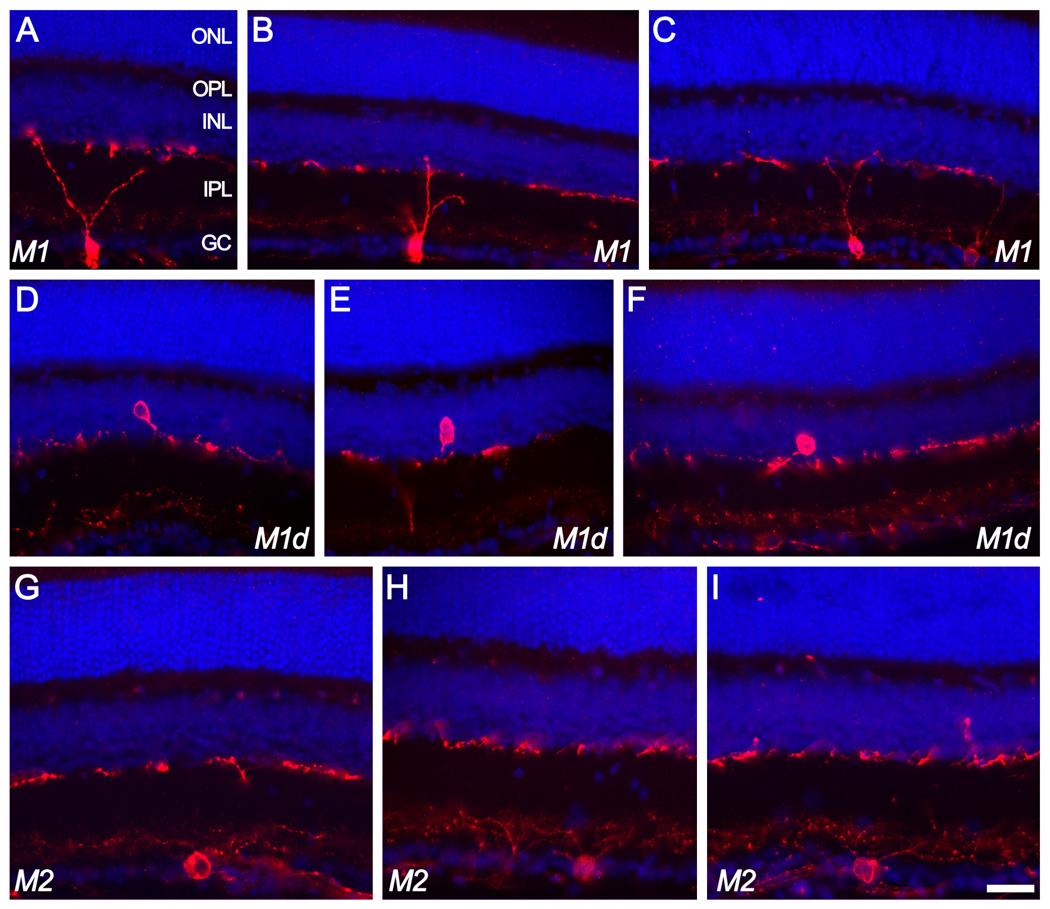
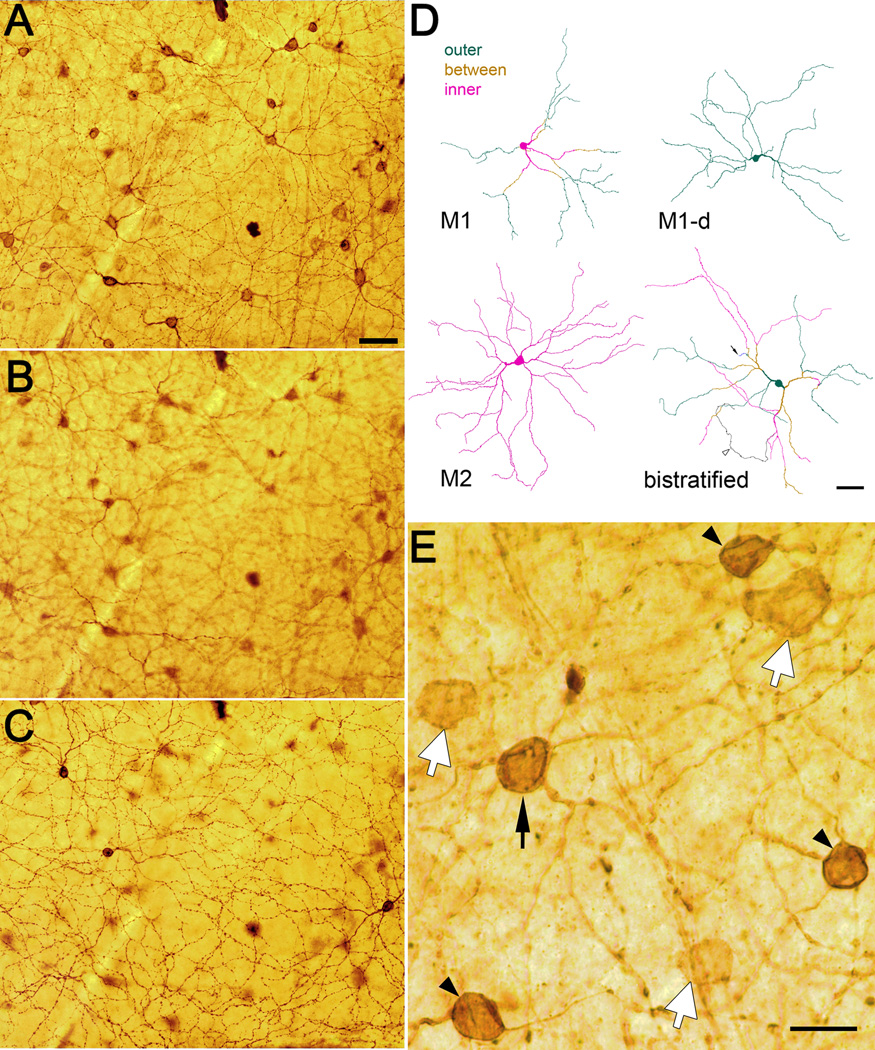
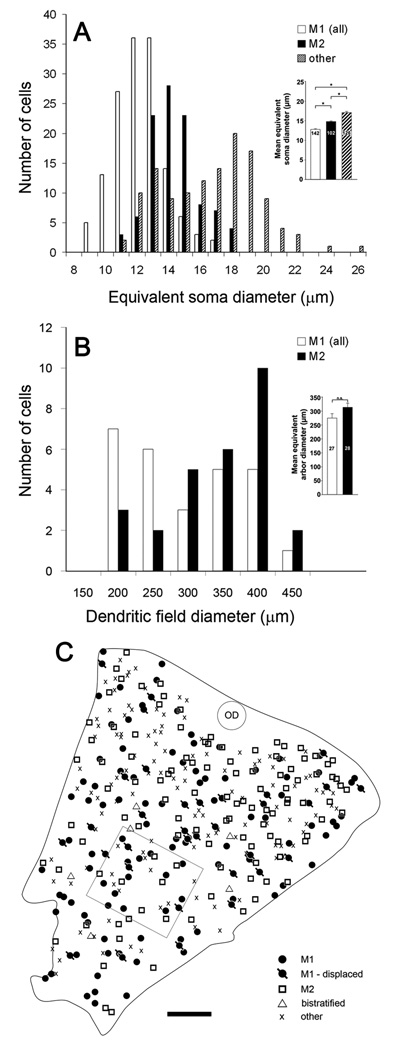
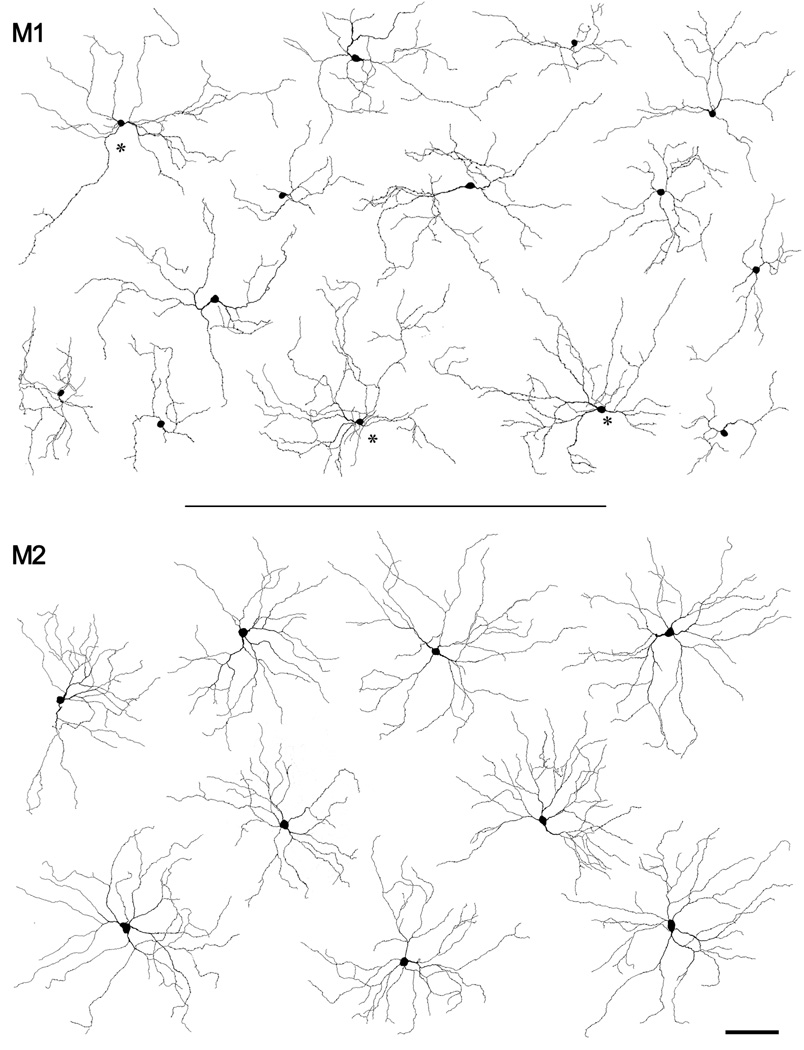
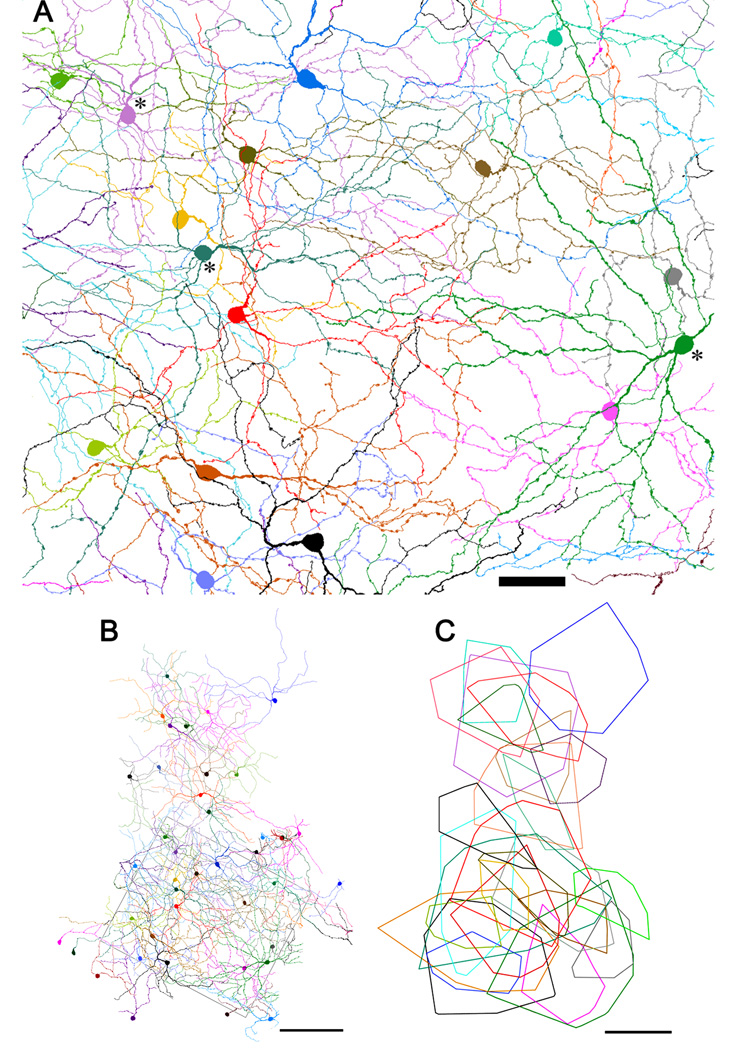
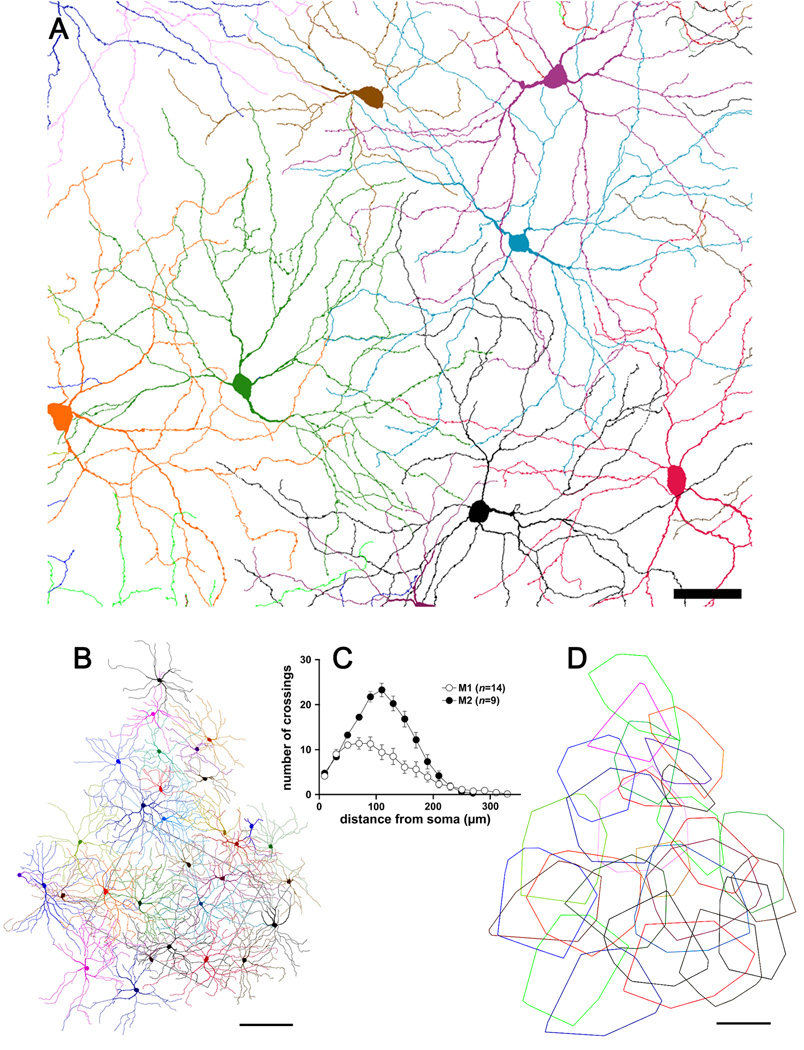
Melanopsin is the photopigment of intrinsically photosensitive retinal ganglion cells (ipRGCs). Melanopsin immunoreactivity reveals two dendritic plexuses within the inner plexiform layer (IPL) and morphologically heterogeneous retinal ganglion cells. Using enhanced immunohistochemistry, we provide a fuller description of murine cell types expressing melanopsin, their contribution to the plexuses of melanopsin dendrites, and mosaics formed by each type. M1 cells, corresponding to the originally described ganglion-cell photoreceptors, occupy the ganglion cell or inner nuclear layers. Their large, sparsely branched arbors (mean diameter 275 microm) monostratify at the outer limit of the OFF sublayer. M2 cells also have large, monostratified dendritic arbors (mean diameter 310 microm), but ramify in the inner third of the IPL, within the ON sublayer. There are approximately 900 M1 cells and 800 M2 cells per retina; each type comprises roughly 1-2% of all ganglion cells. The cell bodies of M1 cells are slightly smaller than those of M2 cells (mean diameters: 13 microm for M1, 15 microm for M2). Dendritic field overlap is extensive within each type (coverage factors approximately 3.8 for M1 and 4.6 for M2 cells). Rare bistratified cells deploy terminal dendrites within both melanopsin-immunoreactive plexuses. Because these are too sparsely distributed to permit complete retinal tiling, they lack a key feature of true ganglion cell types and may be anomalous hybrids of the M1 and M2 types. Finally, we observed weak melanopsin immunoreactivity in other ganglion cells, mostly with large somata, that may constitute one or more additional types of melanopsin-expressing cells.


Figures

Figure 1
Figure 1
Ganglion cells of the M1 and M2 types as revealed in vertical sections of the mouse retina immunostained for melanopsin (red). A nuclear counterstain (DAPI; blue) reveals cellular laminae. Top two rows of images (A–F) illustrate melanopsin-immunoreactive cells of the M1 type, characterized by dendritic arborizations in the outer melanopsin immunoreactive plexus lying at the boundary between inner plexiform and inner nuclear layers. Some of these M1 cells were conventionally placed with somata in the ganglion cell layer (top row; A–C) while others (“M1d”) had somata displaced to the inner nuclear layer (middle row; D–F). The fainter inner (M2) plexus is barely detectable in some of these images. M2 cells (bottom row; G–I) had conventionally placed somata and laterally spreading dendrites entering the inner (M2) plexus of immunopositive dendrites. Scale bar: 30 µm. ONL=outer nuclear layer; OPL=outer plexiform layer; INL=inner nuclear layer; IPL=inner plexiform layer; GC=ganglion cell layer.
Figure 2
Figure 2
Melanopsin immunostaining in retinal wholemounts and the cell types it reveals. A–C: Three planes of focus through a mouse wholemount retina showing melanopsin-like immunoreactivity as revealed by immunoperoxidase labeling. Focal plane in A lies in the middle of the inner (M2) plexus of immunoreactive dendrites. Conventionally placed immunoreactive cell bodies are also in sharp focus. Focal plane in B lies between the two plexuses of immunoreactive dendrites. Immunoreactive processes in sharp focus are rare, and consist almost entirely of the proximal dendrites of conventionally placed M1 cells ascending to the outer IPL. Focal plane in C is in the middle of the outer (M1) plexus of immunoreactive dendrites. Somata of three displaced M1 cells are also in sharp focus. Scale bar in A (50 µm) applies to A–C. D: Representative examples of the dendritic architecture of each of four varieties of melanopsin immunopositive ganglion cells as reconstructed from the immunoperoxidase-stained retina shown in A–C. Processes and somata are color coded to distinguish those in or near the inner (M2) plexus (magenta) from those in or near the outer (M1) plexus (green). Processes in the middle of the IPL, between the two plexuses, are shown in gold. The M1 cell has a conventionally placed cell body and terminal dendrites in the outer dendritic plexus, but proximal dendrites must course through the inner plexus. The displaced M1 cell (“M1-d”) has a soma in the inner nuclear layer and all processes within the outer plexus. The M2 cell has a conventionally placed soma and dendrites restricted to the inner plexus. The bistratified cell illustrated has a displaced soma (though others are conventionally placed) and terminal dendrites in both the inner and outer plexuses. An unusual feature of this bistratified cell is the presence of one short process ascending from the IPL through the INL to terminate near the outer plexiform layer (arrow), a feature described previously for melanopsin expressing dendrites in rat retina (Hattar et al., 2002). The arrowhead marks the axon (black), which arose from a dendrite. Scale bar: 50 µm. E: Three types of melanopsin-immunoreactive ganglion cell bodies in the mouse retina. Several large, weakly melanopsin immunopositive cells (white arrows) are shown in relation to three neighboring M1 cells (black arrowheads) and a single M2 cell (black arrow). The photomicrograph is drawn from the same retinal wholemount illustrated in Fig. 2; focal plane is within the ganglion cell layer. Scale bar: 20 µm.
Figure 3
Figure 3
Somatic and dendritic-field sizes of several types of melanopsin immunopositive ganglion cells and their spatial distribution in the retina. A: Histogram of equivalent soma diameter of M1 cells (combining conventionally placed and displaced varieties), M2 cells, and the very weakly immunopositive cell bodies without appreciable dendritic staining (“other”). Bistratified cells are not included. Inset : Soma sizes (mean ± SEM) of M1, M2, and “other” cells. Asterisks indicate statistically significant differences (p<0.05). B: Distribution of dendritic field diameters of M1 cells, including displaced M1 cells (white bars;) and M2 cells (black bars). Inset: equivalent dendritic-field diameters (mean ± SEM) of M1 and M2 cells. Asterisks indicate statistically significant difference (p<0.01). C: Map of the distribution of melanopsin immunoreactive cells within a piece of retinal wholemount tissue (rectangular outline indicates location of zone shown in Fig. 2A–C). Different symbols represent different types of melanopsin cells, as determined for each cell from its dendritic stratification and somatic location (ganglion cell layer or inner nuclear layer). The “other” category refers to weakly immunopositive cell bodies without appreciable dendritic staining. OD : optic disk. Scale bar: 250 µm.
Figure 4
Figure 4
Examples of the somadendritic profiles of melanopsin immunopositive ganglion cells of the M1 and M2 types. Top: Tracings of fourteen M1 cells. The three cells marked with asterisks had somas displaced to the inner nuclear layer; the rest were conventionally placed. Bottom: Drawings of nine cells of the M2 type. All cells were found in or near the region illustrated in Fig. 2A–C. Scale bar: 50 µm.
Figure 5
Figure 5
The mosaic of M1 cells. A: Reconstruction of the M1 cell mosaic within the retinal region illustrated in Figs. 2A–C. Three displaced cells are included, indicated by asterisks near cell bodies. The processes of bistratified cells within the outer plexus have been excluded. Scale bar: 50 µm B: Reconstruction of the same mosaic over a larger area, shown at reduced magnification. Rectangular outline marks the region illustrated in panel A and Figs. 2A–C. Not all cells outside the rectangle have been fully reconstructed. Scale bar: 200 µm. C: Dendritic field areas of fully reconstructed M1 cells from panel B represented as minimal convex polygons fully enclosing the dendritic profile. Scale bar: 200 µm.
Figure 6
Figure 6
Displaced M1 cells do not tile the retina. Reconstruction of the mosaic form by displaced M1 cells. The mosaic is identical to that in Fig. 2C except that conventionally placed M1 cells have been deleted, leaving only displaced M1 cells. Scale bar: 100 µm.
Figure 7
Figure 7
The mosaic of M2 cells. A: Reconstruction of the M2 cell mosaic within the retinal region illustrated in Figs. 2A–C. The processes of bistratified cells within the inner plexus have been excluded. Scale bar: 50 µm. B: Reconstruction of the same mosaic over a larger area, shown at reduced magnification. Rectangular outline marks the region illustrated in panel A and Figs. 2A–C and Fig. 5A. C: Sholl analysis of dendritic branching pattern of M2 cells in comparison to that in M1 cells. Mean number of dendritic crossings ± SEM. D: Dendritic field areas of fully reconstructed M2 cells from panel B represented as minimal convex polygons fully enclosing the dendritic profile. Scale bar: 200 µm.

Similar articles

Cited by

References

    1. Badea TC, Nathans J. Quantitative analysis of neuronal morphologies in the mouse retina visualized by using a genetically directed reporter. J Comp Neurol. 2004;480(4):331–351. - PubMed
    1. Balasubramanian V, Sterling P. Receptive fields and functional architecture in the retina. J Physiol. 2009;587(Pt 12):2753–2767. - PMC - PubMed
    1. Baver SB, Pickard GE, Sollars PJ. Two types of melanopsin retinal ganglion cell differentially innervate the hypothalamic suprachiasmatic nucleus and the olivary pretectal nucleus. Eur J Neurosci. 2008;27(7):1763–1770. - PubMed
    1. Berson DM, Dunn FA, Takao M. Phototransduction by retinal ganglion cells that set the circadian clock. Science. 2002;295(5557):1070–1073. - PubMed
    1. Coombs J, van der List D, Wang GY, Chalupa LM. Morphological properties of mouse retinal ganglion cells. Neuroscience. 2006;140(1):123–136. - PubMed

Publication types