. 2010 Jul 1;518(13):2456-74.
doi: 10.1002/cne.22347.

Light responses and morphology of bNOS-immunoreactive neurons in the mouse retina

Affiliations

Light responses and morphology of bNOS-immunoreactive neurons in the mouse retina

Ji-Jie Pang et al. J Comp Neurol. .

Abstract

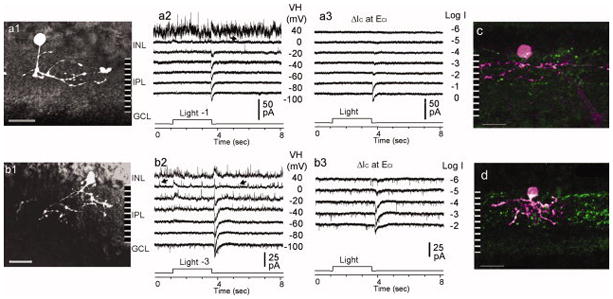
Nitric oxide (NO), produced by NO synthase (NOS), modulates the function of all retinal neurons and ocular blood vessels and participates in the pathogenesis of ocular diseases. To further understand the regulation of ocular NO release, we systematically studied the morphology, topography, and light responses of NOS-containing amacrine cells (NOACs) in dark-adapted mouse retina. Immunohistological staining for neuronal NOS (bNOS), combined with retrograde labeling of ganglion cells (GCs) with Neurobiotin (NB, a gap junction permeable dye) and Lucifer yellow (LY, a less permeable dye), was used to identify NOACs. The light responses of ACs were recorded under whole-cell voltage clamp conditions and cell morphology was examined with a confocal microscope. We found that in dark-adapted conditions bNOS-immunoreactivity (IR) was present primarily in the inner nuclear layer and the ganglion cell layer. bNOS-IR somas were negative for LY, thus they were identified as ACs; nearly 6% of the cells were labeled by NB but not by LY, indicating that they were dye-coupled with GCs. Three morphological subtypes of NOACs (NI, NII, and displaced) were identified. The cell density, intercellular distance, and the distribution of NOACs were studied in whole retinas. Light evoked depolarizing highly sensitive ON-OFF responses in NI cells and less sensitive OFF responses in NII cells. Frequent (1-2 Hz) or abrupt change of light intensity evoked larger peak responses. The possibility for light to modify NO release from NOACs is discussed.


Figures

Figure 1
Figure 1
Confocal micrographs of the GCL in flat-mounted wild type mouse retinas. The retinas are retrogradely labeled by LY and NB. The dyes highlight GCs in entire retinas. The dyes show diffusion gradient, with the strongest labeling in axon boundless, medium labeling in GC somas and weaker labeling in GC dendrites. Open arrow: blood vessels; arrows: axon bundles; LY: Lucifer yellow; NB: neurobiotin; GCL: ganglion cell layer; Scale bars: 100μm in a; 20 μm in b.
Figure 2
Figure 2
Confocal micrographs of retinas from wild type (W.T., a to e) and bNOS knockout mice (bNOS KO, Nos1tm1Plh−/−, f and g). a is a whole-mounted retina labeled by LY (blue), NB (red) and TO-PRO-3 (green). All LY-positive somas in the GCL and INL contain NB. Weak NB signal is present in a small portion of LY negative somas (asterisks in a). Flat-mounted retinas (b and c) and vertical sections (d and e) from wild type mice are triple labeled by bNOS antibody (green), GFAP antibody (blue) and retrograde dye NB (red). A flat-mounted retina (g) and a retina slice (f) from bNOS knockout mouse retina are triple labeled by bNOS antibody (green), NB (red) and LY (blue). The bNOS-IR is not colocalized with LY and NB in the images. bNOS-IR somas are present in the GCL and INL in wild type mouse retinas (b to e), but are absent in the bNOS knockout mouse retinas (g and f). Some bNOS-IR somas are labeled weakly (asterisks in b and c). The bNOS-IR in the NFL (b, e and g, arrows), being partially colocalized with the GFAP-IR, is present in both wild type and bNOS knockout mice. Open arrow in b: blood vessels; IR: immunoreactive; LY:Lucifer yellow; NB: neurobiotin; INL: inner nuclear layer; IPL: inner plexiform layer; GCL: ganglion cell layer; NFL: nerve fiber layer. Scale bars: 20 μm.
Figure 3
Figure 3
Strongly stained bNOS-IR neurons (NI). a–d are stacked confocal micrographs of vertical retinal sections that are double-labeled for bNOS (green in left panels and black in right panels) and NB (magenta in left panels). The images show morphological variation of NI cells: narrowly monostratified NI cells (in a and b) and broadly monostratified NI cells (in c and arrow in d). The single apical dendrites of the cells branch into secondary dendrites at the level of 20% to 40% of IPL depth and extend in the lamina near 50% of the IPL depth. The gap junction-permeable tracer NB was backfilled into GCs. NB does not label these NI cells, indicating no gap junctions between these cells and GCs. Astrocytes in the NFL are partially colocalized with the bNOS-IR; and the labeling is presumably nonspecific. The OSL and OPL are weakly labeled. NB: neurobiotin; IR-immunoreactive; OSL: outer segment layer; ONL: outer nuclear layer; OPL: outer plexiform layer; INL: inner nuclear layer; IPL: inner plexiform layer; GCL: ganglion cell layer; NFL: nerve fiber layer; Scale bar: 20 μm.
Figure 4
Figure 4
Weakly stained bNOS-IR neurons (NII). a–d are stacked confocal micrographes of vertical retinal sections that are double labeled for bNOS (green in left panels and black in right panels) and NB (magenta in left panels). The brightness of the bNOS signals is deliberately enhanced. The images show morphological variation of NII cells: stratified NIIin a and b, pyramidally branched NII in c and d, and displaced monostratified cells in d (asterisk). NB does not label these bNOS-IR cells, indicating no gap junctions between these cells and GCs. IR: immunoreactive; NB: neurobiotin; INL: inner nuclear layer; IPL: inner plexiform layer; GCL: ganglion cell layer; NFL: nerve fiber layer; Scale bar: 20 μm.
Figure 5
Figure 5
Tracer-coupled NI cell. a and b are stacked confocal micrographs of vertical retinal sections that are triple labeled for bNOS (white in a1 and b1, and green in a3 and b3), NB (white in a2 and b2, and red in a3 and b3) and LY (blue in a3 and b3). GCs were retrogradely labeled by NB and LY. The NI cell (in a) contains weak NB signal but no LY, suggesting that the cell obtains NB from GCs through gap junctions. GCs (in a and b), including displaced GCs (in b, asterisks), are double stained by LY and NB (in purple, a3 and b3), but none of them are positive for bNOS. LY: Lucifer yellow; NB: neurobiotin; GCs-ganglion cells; INL: inner nuclear layer; IPL: inner plexiform layer; GCL: ganglion cell layer; NFL: nerve fiber layer; Scale bar: 20 μm.
Figure 6
Figure 6
Topographical distribution of bNOS-IR neurons. a, b and c are stacked confocal micrographs of horizontal optical sections crossing a flat-mounted retina. In the INL (a) are observed strongly stained somas of NI cells and weakly stained somas of NII cells. Most bNOS-IR somas in the GCL (c) are weakly stained. A loose network is formed primarily by the dendrites of NI cells (b). The distributions of the somas are depicted in d for NI cells, e for NII cells and f for the displaced cells. The triangles in d2~f2 denote the optic nerve head. In d1, e1 and f1, are shown the histograms of the distance to the nearest neighbor for each type of NOACs, which are superimposed with normal Gaussian distribution fitting curves. The abscissa in the histograms represents the bin of the distance, and the ordinate represents the count of cell number. It indicates that the distributions are well fit by normal Gaussian function. D: dorsal; T: temporal; V: ventral; N: nasal; INL: inner nuclear layer; IPL: inner plexiform layer; GCL: ganglion cell layer; Scale bar: 20 μm in a~c, 921 μm in d2, e2 and f2.
Figure 7
Figure 7
Light responses and individual cell morphology of NI cells in the mouse retina. The light-evoked current responses to 2.5 s light steps (500 nm, −4.0 (4.0 log unit attenuation)) at various holding potentials (VH) (a2 and b2) and various light intensities (at ECl only) (a3 and b3) were recorded from a narrowly mono-stratified NI cell (a1) and a broadly mono-stratified NI (b1) cell. Both of the cells exhibit ON-OFF-type light responses with small spontaneous excitatory postsynaptic currents (EPSCs, arrows in a2 and b2) and small ΔICl. The ΔIC at light offset (ΔIC_offset) is more substantial than ΔIC at light onset (ΔIC_onset). ΔIC_onset is more transient in the NI cell in a, but more sustained in the NI cell in b. The cells in c and d were filled with NB during recording and stained for NB (red) and bNOS (green) thereafter. c- a narrowly mono-stratified bNOS-IR NI cell; b- a broadly mono-stratified bNOS-IR NI cell. NB: neurobiotin; ACs: amacrine cells; IR: immunoreactive; EC: cation equilibrium potential; ECl: chloride equilibrium potential; INL: inner nuclear layer; IPL: inner plexiform layer; GCL: ganglion cell layer; ΔIC: light-evoked cation currents recorded at ECl (near −60 mV in the experimental condition); ΔICl: light-evoked chloride currents recorded at EC (near 0 mV); Scale bar: 20 μm.
Figure 8
Figure 8
Light responses and individual cell morphology of NII cells in the mouse retina. The light-evoked current responses to 2.5 s light steps (500 nm, −1.0 or −3.0 (1.0 or 3.0 log unit attenuation) at various holding potentials (VH) (a2 and b2) and various light intensities (at ECl only) were recorded in a stratified NII (a1) and a pyramidally branched NII (b1) cells. Both of the cells typically exhibit OFF-type light responses, which are characterized by a large transient ΔIC at light offset (ΔIC_offset). Both types of the cells show spontaneous inhibitory postsynaptic currents (IPSCs, at EC, arrows in a2 and b2), small ΔICl and tiny sustained ΔIC during light ON; but the currents are slightly larger on pyramidally branched cells. The cells in c and d were filled with NB during recording and were stained for NB (red) and bNOS (green) thereafter. c- a stratified bNOS-IR NII cell; d- a pyramidally branched bNOS-IR NII cell; NB: neurobiotin; ACs: amacrine cells; IR: immunoreactive; EC: cation equilibrium potential; ECl: chloride equilibrium potential; INL: inner nuclear layer; IPL: inner plexiform layer; GCL: ganglion cell layer; ΔIC: light-evoked cation current recorded at ECl (near −60 mV in the experimental condition); ΔICl: light-evoked chloride current recorded at EC (near 0 mV); Scale bar: 20 μm.
Figure 9
Figure 9
Light sensitivity of NOACs. The amplitudes of ΔIC are normalized and plotted as a function of the light intensity in log unit (log I). Each data point represents the amplitude of ΔIC from individual cells at a certain light intensity. Filled and open symbols represent the ΔIC_offset for NI (n=5) and NII cells (n=5), respectively (a). Gray symbols depict ΔIC_onset of NI cells (n=4, in b). The data is fitted by Hill equations as described in the methods. The fitting curves of the offset responses reveal a wide dynamic range for both NI and NII cells. However, NI cells display uniformly high light sensitivity (solid fitting curve in a), and NII cells display lower light sensitivity with large variation (broken fitting curve in a). ΔIC_onset and ΔIC_offset of NI cells exhibit similar light sensitivity and dynamic range (b). ΔIC: light-evoked cation current; ΔIC_Onset: ΔIC at light onset; ΔIC_Offset: ΔIC at light offset.
Figure 10
Figure 10
Light durations and frequencies. A series of light durations, ranged from 12 to 2500 ms (a), were used to evoke ΔIC (b) on a NI cell. The delays of ΔIC_onset are rather stable. The peak widths ofΔIC_onset are not clearly related to light duration for shorter light steps (12 to 180 ms). Longer light steps cause sustained inward ΔIC during light on. Along with the elongation of light duration, the amplitude of offset peak gradually grows, but the peak width becomes progressively shorter. Two optimal flicker patterns are showed in c with a light on time of 750 ms and 140 ms. Light: 500 nm, −4; ΔIC: light-evoked cation current; ΔIC_Onset: ΔIC at light onset.
Figure 11
Figure 11
Effect of DNQX on light responses in NI and NII cells. The light-evoked currents are recorded at various holding potentials (VH). The light-evoked currents in a NI (the cell a in Fig. 7) and a NII (the cell b in Fig. 8) cell are blocked by 40 μM DNQX applied in bath. Light: 500 nm.
Figure 12
Figure 12
Schematic diagram of major subtypes of NOACs in the mouse retina. NI cells possess large strong bNOS-IR somas. Their dendrites ramify close to the middle of the IPL. NI cells display ON-OFF light responses. NII and displaced NOACs possess smaller and weaker bNOS-IR somas but larger nuclei. The displaced NOACs ramify in the middle of the IPL resembling NI cells. The dendrites of stratified NII cells ramify near 10% and 40% to 60% of the IPL depth; and those of other NII cells cover a pyramidal area in the IPL and terminate near 60% of IPL depth. OFF light responses are revealed on NII cells.

Similar articles

Cited by

References

    1. Ahmad I, Leinders-Zufall T, Kocsis JD, Shepherd GM, Zufall F, Barnstable CJ. Retinal ganglion cells express a cGMP-gated cation conductance activatable by nitric oxide donors. Neuron. 1994;12:155–165. - PubMed
    1. Akopian A, Witkovsky P. Calcium and retinal function. Mol Neurobiol. 2002;25:113–132. - PubMed
    1. Brorson JR, Manzolillo PA, Miller RJ. Ca2+ entry via AMPA/KA receptors and excitotoxicity in cultured cerebellar Purkinje cells. J Neurosci. 1994;14:187–197. - PMC - PubMed
    1. Bugnon O, Schaad NC, Schorderet M. Nitric oxide modulates endogenous dopamine release in bovine retina. Neuroreport. 1994;5:401–404. - PubMed
    1. Chiou GC. Review: effects of nitric oxide on eye diseases and their treatment. J Ocul Pharmacol Ther. 2001;17:189–198. - PubMed

Publication types

MeSH terms