Comparative Study
. 2010 May 26:11:281.
doi: 10.1186/1471-2105-11-281.

A comparison of probe-level and probeset models for small-sample gene expression data

Affiliations
Comparative Study

A comparison of probe-level and probeset models for small-sample gene expression data

John R Stevens et al. BMC Bioinformatics. .

Abstract

Background: Statistical methods to tentatively identify differentially expressed genes in microarray studies typically assume larger sample sizes than are practical or even possible in some settings.

Results: The performance of several probe-level and probeset models was assessed graphically and numerically using three spike-in datasets. Based on the Affymetrix GeneChip, a novel nested factorial model was developed and found to perform competitively on small-sample spike-in experiments.

Conclusions: Statistical methods with test statistics related to the estimated log fold change tend to be more consistent in their performance on small-sample gene expression data. For such small-sample experiments, the nested factorial model can be a useful statistical tool. This method is implemented in freely-available R code (affyNFM), available with a tutorial document at http://www.stat.usu.edu/~jrstevens.


Figures

Figure 1
Figure 1
Gaussian mixture model from PLLM. The plot of average intensity vs. treatment effect as estimated in the PLLM approach is used to identify underlying components in a Gaussian mixture model. The blue points correspond to the known spiked-in genes in each of the three datasets. The Golden Spike dataset has three main components, with one predominantly corresponding to the spiked-in genes. In the other datasets the components are not as clear.
Figure 2
Figure 2
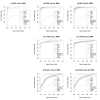
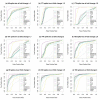
ROC curves for RMA-preprocessed data. With RMA preprocessing, the performance of several methods testing for differential expression is compared using (a) the full 4 × 4 comparison of the HGU95A spike-in data, as well as the averages across (b) all 3 × 3 and (c) all 2 × 2 subsets. The methods are also compared using (d) the full 3 × 3 and (e) the average of all 2 × 2 comparisons of the HGU133A spike-in data, as well as using (f) the full 3 × 3 and (g) the average of all 2 × 2 comparisons of the Golden Spike spike-in data.
Figure 3
Figure 3
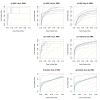
Partial ROC curves for RMA-preprocessed data. (a-h) Partial ROC curves from Figure 2 to focus on portions of greatest interest - low false positive and high true positive rates. Note that the vertical axes in (f) and (g) are on the log scale to facilitate visualization. The same color legend of Figure 2 applies here.
Figure 4
Figure 4
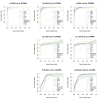
ROC curves for GCRMA-preprocessed data. With GCRMA preprocessing, the performance of several methods testing for differential expression is compared using (a) the full 4 × 4 comparison of the HGU95A spike-in data, as well as the averages across (b) all 3 × 3 and (c) all 2 × 2 subsets. The methods are also compared using (d) the full 3 × 3 and (e) the average of all 2 × 2 comparisons of the HGU133A spike-in data, as well as using (f) the full 3 × 3 and (g) the average of all 2 × 2 comparisons of the Golden Spike spike-in data.
Figure 5
Figure 5
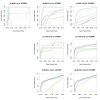
Partial ROC curves for GCRMA-preprocessed data. (a-h) Partial ROC curves from Figure 4 to focus on portions of greatest interest - low false positive and high true positive rates. Note that the vertical axes in (f) and (g) are on the log scale to facilitate visualization. The same color legend of Figure 4 applies here.
Figure 6
Figure 6
ROC curves for Golden Spike data, by known fold chang. With RMA preprocessing, the performance of several methods testing for differential expression is compared using the full 3 × 3 comparison of the Golden Spike spike-in data, treating the eight levels of reported spiked-in fold changes separately. Several methods have difficulty detecting differential expression for spiked-in genes with fold changes 1.5 and 1.7 in particular.
Figure 7
Figure 7
Rank of test statistics in Golden Spike data, by fold change. (a-e) With RMA preprocessing in the full 3 × 3 comparison of the Golden Spike spike-in data, the overall ranks of test statistics from five methods are compared to the spiked-in fold changes. (The known fold change of 1 corresponds to non-spiked-in genes.) Both PLLM and PUMA show an overall drop in ranks for higher fold changes, while RMANOVA, NFM, and PLW show an overall increase in ranks for higher fold changes. There is a clear overall drop in NFM and PLW ranks for spiked-in genes with fold changes 1.5 and 1.7. (f) With RMA preprocessing in the same Golden Spike comparison, the distributions of estimated log fold changes are compared to the known spiked-in fold changes. There is a clear drop in estimated log fold changes for spiked-in genes with known fold changes 1.5 and 1.7. This contributes to the poorer performance of the fold-change-based methods at these fold change levels.
Figure 8
Figure 8
Comparison of results on Bovine NT data. (a) The relationships among the methods considered here are visualized by clustering the vectors of test statistic ranks within each method when applied to the bovine NT data. (b) A biplot (based on the first two principal components of ranks of test statistics within method) visualizes the same relationships. The principal components were shifted for visualization purposes, to allow both axes to be on the log scale.
Figure 9
Figure 9
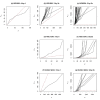
F-quantile plots of the NFM test statistics of non-spike-in genes. Quantile plots for the HGU95A, HGU133A, and Golden Spike datasets show that the theoretical F-distribution (vertical axis) is not a good approximation for the sampling distribution of the observed NFM test statistics (horizontal axis). A solid black curve represents the quantile plot for the test statistics of the non-spike-in genes in each full data and subset comparison. Deviations from the dashed red reference line of equality indicate departures from the theoretical distribution.
Figure 10
Figure 10
Significance plots of NFM permutation results. (a-c) Histograms of NFM permutation p-values for the full data comparisons in each of the three spike-in datasets. (d-e) Bubble plots for the spike-in genes of the HGU95A and HGU133A spike-in datasets. The horizontal and vertical axes are the spike-in concentrations for the control and treatment conditions, with axis tick marks on the log scale. The size of the plotting character for each spike-in gene is proportional to the corresponding q-value (converted from NFM permutation p-values). Q-values less than 0.1 are represented as closed blue dots, while q-values greater than 0.1 are represented as open circles. Statistical significance (q-value < 0.1) is more common for genes with higher control and treatment concentrations. (f) The distribution of calculated NFM q-values (converted from NFM permutation p-values) by spiked-in fold-change for the spike-in genes of the Golden Spike dataset.

Similar articles

Cited by

References

    1. Lockhart DJ, Dong H, Byrne MC, Follettie MT, Gallo MV, Chee MS, Mittmann M, Wang C, Kobayashi M, Horton H, Brown EL. Expression monitoring by hybridization to high-density oligonucleotide arrays. Nature Biotechnology. 1996;14 doi: 10.1038/nbt1296-1675. - DOI - PubMed
    1. Aston KI, Li GP, Hicks BA, Sessions BR, Pate BJ, Hammon DS, Bunch TD, White KL. The developmental competence of bovine nuclear transfer embryos derived from cow versus heifer cytoplasts. Animal Reproduction Science. 2006;95:234–243. doi: 10.1016/j.anireprosci.2005.10.011. - DOI - PubMed
    1. Aston KI, Li GP, Hicks BA, Sessions BR, Pate BJ, Hammon DS, Bunch TD, White KL. Effect of the time interval between fusion and activation on nuclear state and development in vitro and in vivo of bovine somatic cell nuclear transfer embryos. Reproduction. 2006;131:45–51. doi: 10.1530/rep.1.00714. - DOI - PubMed
    1. Aston KI, Li GP, Sessions BR, Davis AP, Winger QA, Rickords LF, Stevens JR, White KL. Global Gene Expression Analysis of Bovine Somatic Cell Nuclear Transfer Blastocysts and Cotyledons. Molecular Reproduction and Development. 2009;76:471–482. doi: 10.1002/mrd.20962. - DOI - PubMed
    1. Gentleman R, Huber W, Carey VJ, Irizarry RA, Dudoit S. Bioinformatics and Computational Biology Solutions Using R and Bioconductor. New York, Springer; 2005.

Publication types

MeSH terms

LinkOut - more resources