. 2010 May 26:5:5.
doi: 10.1186/1750-2187-5-5.

Zinc release from thapsigargin/IP3-sensitive stores in cultured cortical neurons

Affiliations

Zinc release from thapsigargin/IP3-sensitive stores in cultured cortical neurons

Christian J Stork et al. J Mol Signal. .

Abstract

Background: Changes in ionic concentration have a fundamental effect on numerous physiological processes. For example, IP3-gated thapsigargin sensitive intracellular calcium (Ca2+) storage provides a source of the ion for many cellular signaling events. Less is known about the dynamics of other intracellular ions. The present study investigated the intracellular source of zinc (Zn2+) that has been reported to play a role in cell signaling.

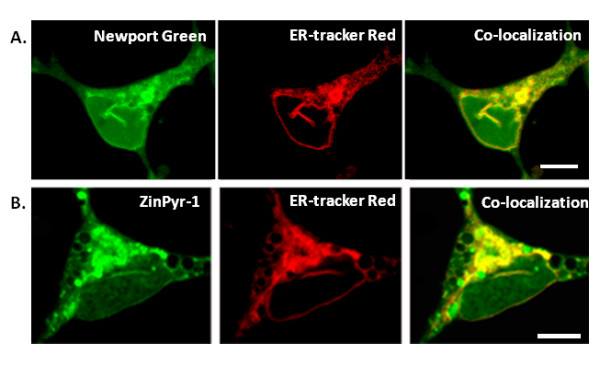
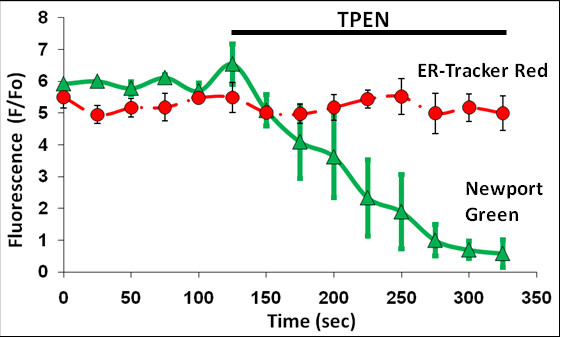
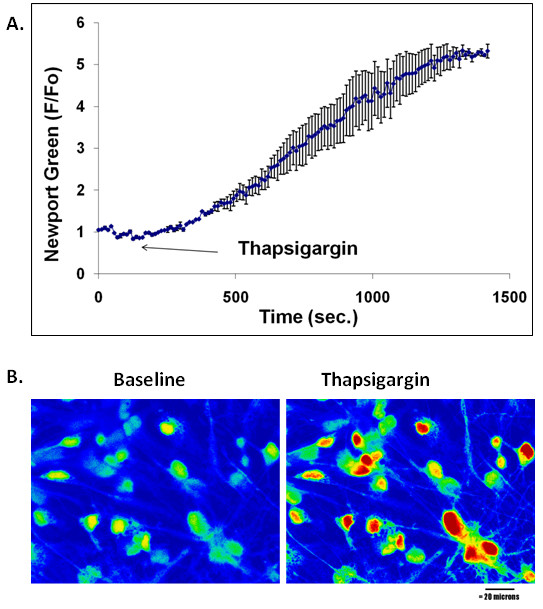
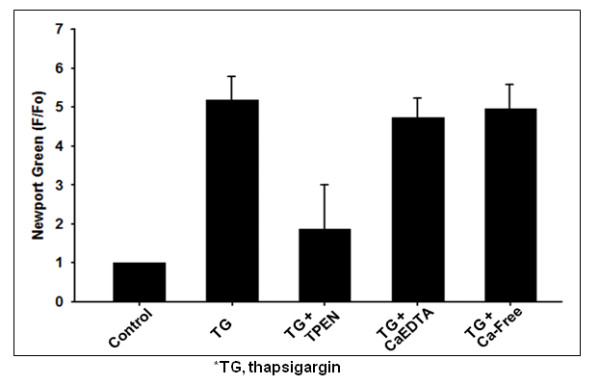
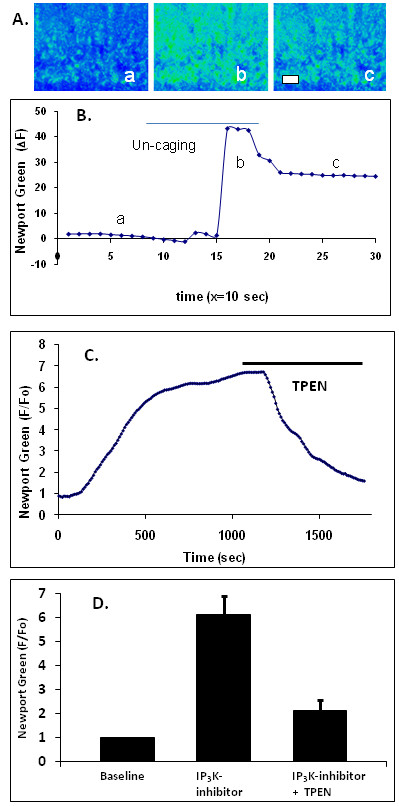
Results: In primary cultured cortical cells (neurons) labeled with intracellular fluorescent Zn2+ indicators, we showed that intracellular regions of Zn2+ staining co-localized with the endoplasmic reticulum (ER). The latter was identified with ER-tracker Red, a marker for ER. The colocalization was abolished upon exposure to the Zn2+ chelator TPEN, indicating that the local Zn2+ fluorescence represented free Zn2+ localized to the ER in the basal condition. Blockade of the ER Ca2+ pump by thapsigargin produced a steady increase of intracellular Zn2+. Furthermore, we determined that the thapsigargin-induced Zn2+ increase was not dependent on extracellular Ca2+ or extracellular Zn2+, suggesting that it was of intracellular origin. The applications of caged IP3 or IP3-3Kinase inhibitor (to increase available IP3) produced a significant increase in intracellular Zn2+.

Conclusions: Taken together, these results suggest that Zn2+ is sequestered into thapsigargin/IP3-sensitive stores and is released upon agonist stimulation.


Figures

Figure 1
Figure 1
Co-localization of intracellular Zn2+ and ER fluorescence. Images of cultured cortical neurons co-labeled with the intracellular fluorescent Zn2+ indicators and a live cell marker for the ER. A. Fluorescent Zn2+ indicator Newport Green AM co-localizes with the ER marker ER-Tracker Red. B. Fluorescent Zn2+ indicator ZinPyr-1 co-localizes with the ER marker ER-Tracker Red. Cells were incubated with 10 μM of the specified fluorescent Zn2+ indicator and 1 μM ER-Tracker Red then imaged using a LSM510 confocal microscope equipped with a 100x/1.3NA objective.
Figure 2
Figure 2
Effect of Zn2+ chelation. The graph indicates the fluorescent response of Newport Green (green line) and ER-Tracker Red (red line) in unstimulated neurons upon TPEN (10 μM) exposure, data points represent the mean ± SD of n = 5 trials. The quenching of Newport Green fluorescence with TPEN indicates the presence of free Zn2+ in the basal condition.
Figure 3
Figure 3
Thapsigargin-induced Zn2+ release in cultured cortical neurons. A. The graph shows the increases in fluorescence intensity of cells in response to the treatment with thapsigargin (2 μM). Data points represent the mean ± SD of n = 3 trials. Cells were labeled with Newport Green (10 μM). B. Representative fluorescent images of cortical neurons loaded with Newport Green before and after exposure to thapsigargin.
Figure 4
Figure 4
Summary of Zn2+ transients induced by thapsigargin in cortical neurons. The bar graphs show peak fluorescence after the treatment with thapsigargin alone (n = 6), thapsigargin plus TPEN (10 μM; n = 6), thapsigargin plus CaEDTA (1 mM; n = 3), and thapsigargin in the medium without added Ca2+ (n = 4). Data points represent the mean ±SD.
Figure 5
Figure 5
IP3 stimulation results in the release of intracellular Zn2+. A. The photo-uncaging of caged IP3 (2 μM) in brain hippocampal neurons loaded with the Zn2+ fluorescent indicator Newport Green results in an increase of cytosolic Zn2+. Scale bar = 20 μm and the images a, b, and corresponding to points in B. B. The graph shows a change of fluorescence in response to IP3 stimulation. C. A change of fluorescence in responses to the treatments of the IP3-3K inhibitor N2-(m-trifluorobenzyl),N6-(p-nitrobenzyl)purine (20 μM) and TPEN (10 μM) in cells loaded with Newport Green. D. Bar graph shows the average response of Newport Green to the IP3K-inhibitor (n = 4). The application of TPEN at the peak of fluorescence resulted in significant (n = 2) fluorescence quenching, demonstrating that the fluorescence elevation was due to increased free Zn2+.

Similar articles

Cited by

References

    1. Outten CE, O'Halloran TV. Femtomolar sensitivity of metalloregulatory proteins controlling zinc homeostasis. Science. 2001;292:2488–2492. doi: 10.1126/science.1060331. - DOI - PubMed
    1. Vallee BL, Falchuk KH. The biochemical basis of zinc physiology. Physiol Rev. 1993;73:79–118. - PubMed
    1. Finney LA, O'Halloran TV. Transition metal speciation in the cell: insights from the chemistry of metal ion receptors. Science. 2003;300:931–936. doi: 10.1126/science.1085049. - DOI - PubMed
    1. Cousins RJ, Liuzzi JP, Lichten LA. Mammalian zinc transport, trafficking, and signals. J Biol Chem. 2006;281:24085–24089. doi: 10.1074/jbc.R600011200. - DOI - PubMed
    1. Frederickson CJ, Koh JY, Bush AI. The neurobiology of zinc in health and disease. Nat Rev Neurosci. 2005. - PubMed

LinkOut - more resources