

How perceived threat increases synchronization in collectively moving animal groups
- PMID: 20504810
- PMCID: PMC2982070
- DOI: 10.1098/rspb.2010.0855
How perceived threat increases synchronization in collectively moving animal groups
Abstract
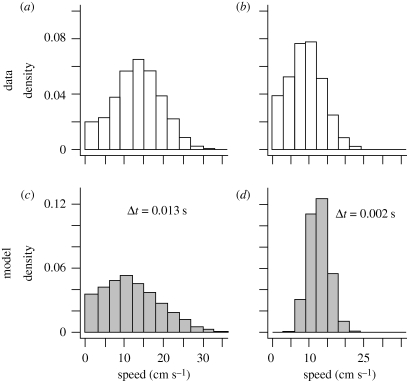
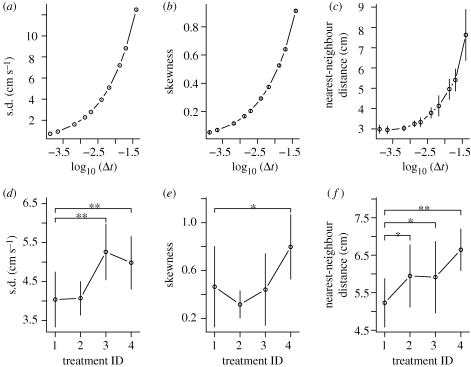
Nature is rich with many different examples of the cohesive motion of animals. Previous attempts to model collective motion have primarily focused on group behaviours of identical individuals. In contrast, we put our emphasis on modelling the contributions of different individual-level characteristics within such groups by using stochastic asynchronous updating of individual positions and orientations. Our model predicts that higher updating frequency, which we relate to perceived threat, leads to more synchronized group movement, with speed and nearest-neighbour distributions becoming more uniform. Experiments with three-spined sticklebacks (Gasterosteus aculeatus) that were exposed to different threat levels provide strong empirical support for our predictions. Our results suggest that the behaviour of fish (at different states of agitation) can be explained by a single parameter in our model: the updating frequency. We postulate a mechanism for collective behavioural changes in different environment-induced contexts, and explain our findings with reference to confusion and oddity effects.
Figures
References
-
- Aoki I.1980An analysis of the schooling behavior of fish: internal organization and communication process. Bull. Ocean Res. Inst., Univ. Tokyo 12, 1–62
-
- Aoki I.1982A simulation study on the schooling mechanism in fish. Bull. Jpn. Soc. Sci. Fish 48, 1081–1088
-
- Ballerini M., et al. 2008Interaction ruling animal collective behavior depends on topological rather than metric distance: evidence from a field study. Proc. Natl Acad. Sci. USA 105, 1232–1237 (doi:10.1073/pnas.0711437105) - DOI - PMC - PubMed
-
- Buhl J., Sumpter D. J. T., Couzin I. D., Hale J. J., Despland E., Miller E. R., Simpson S. J.2006From disorder to order in marching locusts. Science 312, 1402–1406 (doi:10.1126/science.1125142) - DOI - PubMed
-
- Carere C., Montanino S., Moreschini F., Zoratto F., Chiarotti F., Santucci D., Alleva E.2009Aerial flocking patterns of wintering starlings, Sturnus vulgaris, under different predation risk. Anim. Behav. 77, 101–107 (doi:10.1016/j.anbehav.2008.08.034) - DOI
Publication types
MeSH terms
Grants and funding
LinkOut - more resources
Full Text Sources
