Comparative Study
. 2010 Jul;133(Pt 7):1994-2006.
doi: 10.1093/brain/awq117. Epub 2010 May 26.

Spreading depolarizations cycle around and enlarge focal ischaemic brain lesions

Affiliations
Comparative Study

Spreading depolarizations cycle around and enlarge focal ischaemic brain lesions

Hajime Nakamura et al. Brain. 2010 Jul.

Abstract

How does infarction in victims of stroke and other types of acute brain injury expand to its definitive size in subsequent days? Spontaneous depolarizations that repeatedly spread across the cerebral cortex, sometimes at remarkably regular intervals, occur in patients with all types of injury. Here, we show experimentally with in vivo real-time imaging that similar, spontaneous depolarizations cycle repeatedly around ischaemic lesions in the cerebral cortex, and enlarge the lesion in step with each cycle. This behaviour results in regular periodicity of depolarization when monitored at a single point in the lesion periphery. We present evidence from clinical monitoring to suggest that depolarizations may cycle in the ischaemic human brain, perhaps explaining progressive growth of infarction. Despite their apparent detrimental role in infarct growth, we argue that cycling of depolarizations around lesions might also initiate upregulation of the neurobiological responses involved in repair and remodelling.


Figures

Figure 1
Figure 1
Repetitive cyclic CBFIND wave propagation around primary ischaemic lesion in rat cortex after dMCAO (see also Supplementary Video 1). (A) Diagram of the dorsal aspect of the rat brain. Frame (thick lines) indicates field of view for LSF. Vascular territory of distal MCA, ischaemic territory and anti-clockwise cycling (arrow) are indicated. (B) Expansion of the ischaemic lesion after repetitive propagation of eight cyclic CBFIND waves. A region of interest (white circle; 3 mm diameter) located in the boundary zone served for time course analysis of CBFIND and increase of number of pixels with CBFIND <15 ml/100 g/min (Fig. 2C and D). (C) Sequential images demonstrating multiple consecutive turns of CBFIND waves around the ischaemic lesion demarcated by dotted black line. Time after dMCAO is indicated in individual images. Please note that the surrounding of the ischaemic core turned progressively blue compared with the first image, indicating gradual expansion of the ischaemic core. (D) Time course of mean CBFIND (left) and number of pixels with CBFIND <15 ml/100 g/min (right) analysed in boundary zone region of interest (ROI) (Fig. 2B). CBFIND flow increased repetitively while basic CBFIND decreased stepwise during CBFIND wave passage. On the other side, the number of pixels with CBFIND <15 ml/100 g/min increased in the region of interest stepwise with CBFIND waves. (E) Decrease of basic CBFIND (left) and increase of the number of pixels with CBFIND <15 ml/100 g/min (right) in relation to number of CBFIND waves (numbers next to lines). Data analysed in the various rats using region of interest analysis as shown in Fig. 2D.
Figure 2
Figure 2
‘Split’ CBFIND wave propagation around ischaemic lesion after rat dMCAO. (A) Diagram of the dorsal aspect of the rat brain indicates ‘split’ clockwise and anti-clockwise circumferential propagation of two CBFIND waves (arrows) around the ischaemic lesion. (B) Laser speckle image shows darkened inner zone with ischaemic transition and schematic representation of propagating ‘split’ CBFIND wave as well as positions of regions of interest in outer (a, d) and inner border zone (b, c) used for time course analysis of CBFIND. (C) Sequential images demonstrating ‘split’ CBFIND wave propagation around the ischaemic lesion (thin dotted black line in the first image). CBFIND wave originated from one point in the ischaemic boundary zone, separated immediately into two waves, which then propagated in both directions around the ischaemic lesion to collide and vanish at the opposite side. Time after start of CBFIND wave and propagation of the wave front (thick dots) is indicated in individual images. Black bar = 5 mm. (D) Time course of CBFIND (left) in four regions of interest demonstrating in inner zones near the ischaemic core monophasic sustained hypoperfusion (region of interest b) or biphasic hypo-/hyperaemic response (region of interest c), whereas in outer zones always revealed monophasic hyperaemic responses were dominant (regions of interest a, d).
Figure 3
Figure 3
Radial CBFIND wave propagation in the ischaemic boundary zone after cat MCA occlusion (see also Supplementary Video 2). (A) Diagram of the lateral aspect of the cat brain with schematic representation of ischaemic core (dark grey) and border zone (light grey) after MCA occlusion. Arrows indicate territories of MCA and anterior cerebral artery (ACA), pink arrow indicates radial direction of CBFIND wave propagation. (B) Sequential images (1–4) of radial CBFIND wave propagating from inner ischaemic boundary zone (suprasylvian gyrus; SG) to periphery (marginal gyrus; MG). Colour coded CBFIND change indicates hypoperfusion appearance in the suprasylvian gyrus near the ischaemic core in blue, hyperaemic appearance in the MG in red as the wave travels into the ischaemic periphery. Time in images indicates time from onset of CBFIND wave and corresponds to time scale in Fig. 4C. Regions of interest a, b, c in first image served for time course analysis (Fig. 4C). (C) Time course of CBFIND in regions of interest a, b and c, showing the transition from hypo- to hyperaemic appearance as the wave propagates from inner to outer boundary zone of the ischaemic focus. EG = ectosylvian gyrus.
Figure 4
Figure 4
Circumferential CBFIND wave propagation in the ischaemic boundary zone after cat MCA occlusion (see also Supplementary Video 3). (A) Diagram of the lateral aspect of the cat brain (see also Fig. 3A). Pink arrow indicates circumferential direction of CBFIND wave propagation. Temporal emergence of 14 consecutive CBFIND waves is indicated on the right. All waves (other than 12 and 13, asterisks) travelled clockwise. (B) Sequential images of waves 9 and 14 propagating circumferentially in marginal gyrus (MG) around the ischaemic focus. Time on images indicates time from onset of respective CBFIND waves. Regions of interest a (on marginal gyrus; far from ischaemic core), b [on suprasylvian gyrus (SG); close to core] in first images served for time course analysis. Black bars = 5 mm. Arrow heads indicate wave front. Note that the wave front turns into hypoperfusion (blue) in 14th wave. (C) Time course of CBFIND in regions of interest a and b showing consecutive waves 9–14. Waves 12 and 13 travelled anti-clockwise. The transition from hypo- to hyperaemic appearance as the wave propagates from inner to outer boundary zone of the ischaemic focus. Note the continuous decrease of baseline CBFIND in the zone close to the ischaemic core (region of interest b). (D) Zoomed view of time course of CBFIND waves 9 and 14, showing transition from biphasic (hypo- then hyperaemic) CBFIND pattern in wave 9 to more pronounced hypoperfusion pattern in wave 14, particularly in region of interest b. EG = ectosylvian gyrus.
Figure 5
Figure 5
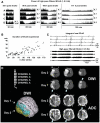
Secondary infarct growth related to multiple appearance of CSD in a patient suffering from ‘malignant’ ischaemic stroke. (A) From the six electrodes of the subdurally implanted electrode strip, ECoG channels A, B, C and D were acquired. CSD associated ECoG depression expanded spatially along the strip electrode from channel D and C to B and finally also A over time. The ECoG signal progressively decreased with repeated CSDs (note the change of scale from 0.7 to 0.2 mV2 in channel D after first episode). (B) In addition, the duration of ECoG suppression and ECoG recovery after each CSD was increasingly prolonged indicating a progressive metabolic deterioration in underlying tissue. (C) Repetitive unidirectional propagations of CSDs at intervals with comparable duration in the ischaemic boundary zone (see arrows) appear as slow potential changes of the integrated raw ECoG (upper panel) and as successive reductions of the high-pass filtered ECoG (lower panel). Since each channel displays the potential difference between its two active electrodes, the spread of the slow potential change from one electrode to the next is seen from the phase reversal between two neighbouring channels sharing a common electrode. (D) MRI was conducted after start of monitoring on Day 2 and at the end of monitoring on Day 7 after stroke. The follow-up MRI showed a growth of infarction with secondary ischaemia of the peri-infarct tissue in which 92 CSDs had occurred over the course of around 5 days of monitoring. Note the newly established lesions around the primary infarct area in the diffusion weighted imaging (DWI) on Day 7 corresponding to reduced apparent diffusion coefficients (ADC) in the same regions (see arrow heads) indicating the process of secondary deterioration. The strip electrode (schematically displayed) was placed over peri-infarct tissue, tangentially to the infarct border, with electrodes generating channel D closest to and electrodes generating channel A most distant to the infarct. Note the concentric pattern of cortical infarct growth.
Figure 6
Figure 6
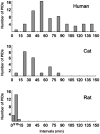
Inter-species comparison of CSD periodicity. Time interval histograms are shown between recurrent cyclic CBFIND waves after dMCAO in rats (n = 6), circumferential CBFIND waves after proximal MCA occlusion in cats (n = 7) and spreading depolarizations in human malignant hemispheric stroke appearing in clusters of CSD (n = 7). Please note that intervals propagating unidirectionally were analysed in cats and human patients. Distributions reveal (i) intervals to be shorter in rats than in cats and humans and (ii) that in humans, intervals are distributed more widely than in cats and rats.

References

    1. Aitken PG, Tombaugh GC, Turner DA, Somjen GG. Similar propagation of SD and hypoxic SD-like depolarization in rat hippocampus recorded optically and electrically. J Neurophysiol. 1998;80:1514–21. - PubMed
    1. Astrup J, Siesjo BK, Symon L. Thresholds in cerebral ischemia - the ischemic penumbra. Stroke. 1981;12:723–5. - PubMed
    1. Back T, Ginsberg MD, Dietrich WD, Watson BD. Induction of spreading depression in the ischemic hemisphere following experimental middle cerebral artery occlusion: effect on infarct morphology. J Cereb Blood Flow Metab. 1996;16:202–13. - PubMed
    1. Brint S, Jacewicz M, Kiessling M, Tanabe J, Pulsinelli W. Focal brain ischemia in the rat: methods for reproducible neocortical infarction using tandem occlusion of the distal middle cerebral and ipsilateral common carotid arteries. J Cereb Blood Flow Metab. 1988;8:474–85. - PubMed
    1. Busch E, Gyngell ML, Eis M, Hoehn-Berlage M, Hossmann KA. Potassium-induced cortical spreading depressions during focal cerebral ischemia in rats: contribution to lesion growth assessed by diffusion-weighted NMR and biochemical imaging. J Cereb Blood Flow Metab. 1996;16:1090–9. - PubMed

Publication types