

Aging per se increases the susceptibility to free fatty acid-induced insulin resistance
- PMID: 20504893
- PMCID: PMC2903785
- DOI: 10.1093/gerona/glq078
Aging per se increases the susceptibility to free fatty acid-induced insulin resistance
Abstract
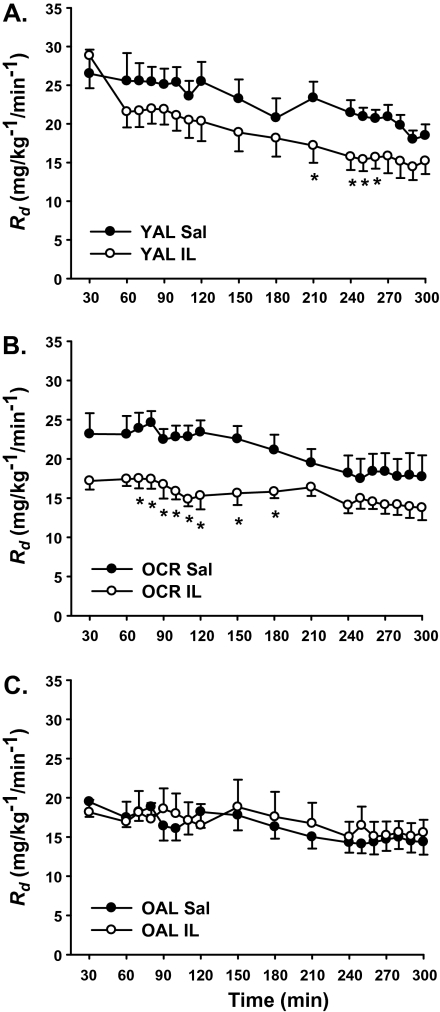
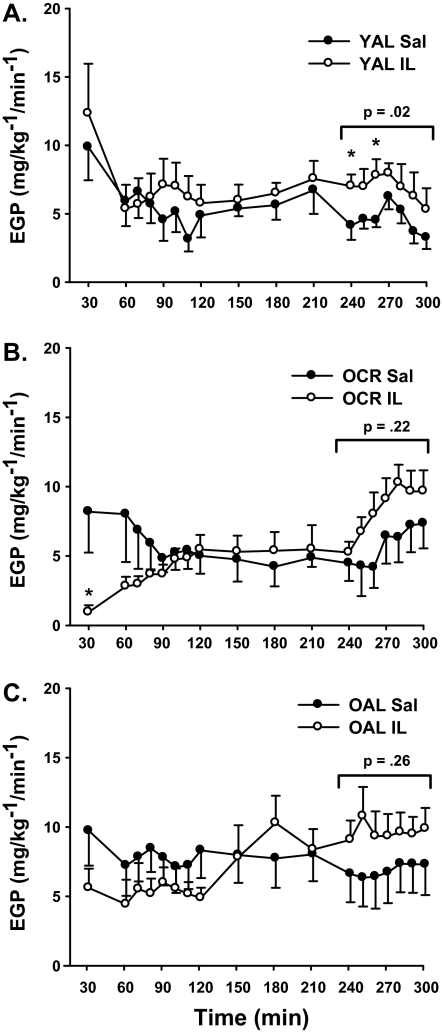
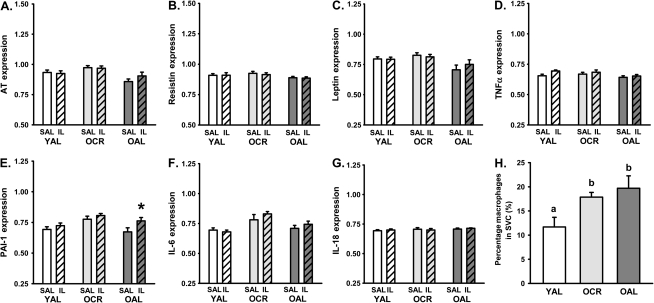
Elevations in systemic free fatty acids (FFA) contribute to insulin resistance. To determine the effects of an acute elevation in FFA on insulin action with aging, we infused saline or intralipid (IL) during a hyperinsulinemic-euglycemic clamp in three groups of rats: young ad libitum-fed (YAL), old ad libitum-fed (OAL), and old on lifelong calorie restriction (OCR). The OCR group was included to distinguish between aging per se and age-related changes in body fat distribution. IL induced marked insulin resistance in both YAL and OCR, but the onset of insulin resistance was approximately two to three times more rapid in OCR as compared with YAL. In response to IL infusion, plasminogen-activating inhibitor-1 (PAI-1) expression was increased in subcutaneous fat from OAL animals. In visceral fat, a marked increase in PAI-1 and interleukin-6 expression was observed in OAL and OCR rats, but not YAL, in response to IL treatment. Thus, aging per se increases the inflammatory response to excess nutrients and vulnerability to FFA-induced insulin resistance with aging.
Figures


Similar articles
-
Fatty acid-induced production of plasminogen activator inhibitor-1 by adipose macrophages is greater in middle-aged versus younger adult participants.J Gerontol A Biol Sci Med Sci. 2012 Dec;67(12):1321-8. doi: 10.1093/gerona/gls200. Epub 2012 Oct 22. J Gerontol A Biol Sci Med Sci. 2012. PMID: 23089338 Free PMC article.
-
Thiazolidinedione treatment prevents free fatty acid-induced insulin resistance in male wistar rats.Diabetes. 2001 Oct;50(10):2316-22. doi: 10.2337/diabetes.50.10.2316. Diabetes. 2001. PMID: 11574414
-
Lifelong exercise and mild (8%) caloric restriction attenuate age-induced alterations in plantaris muscle morphology, oxidative stress and IGF-1 in the Fischer-344 rat.Exp Gerontol. 2008 Apr;43(4):317-29. doi: 10.1016/j.exger.2007.12.012. Epub 2008 Jan 17. Exp Gerontol. 2008. PMID: 18313875 Free PMC article.
-
Short-term calorie restriction reverses vascular endothelial dysfunction in old mice by increasing nitric oxide and reducing oxidative stress.Aging Cell. 2010 Jun;9(3):304-12. doi: 10.1111/j.1474-9726.2010.00557.x. Epub 2010 Mar 13. Aging Cell. 2010. PMID: 20121721 Free PMC article.
-
Interaction between aging and syndrome X: new insights on the pathophysiology of fat distribution.Ann N Y Acad Sci. 1999 Nov 18;892:58-72. doi: 10.1111/j.1749-6632.1999.tb07785.x. Ann N Y Acad Sci. 1999. PMID: 10842652 Review.
Cited by
-
Modulation of Glucose Production by Central Insulin Requires IGF-1 Receptors in AgRP Neurons.Diabetes. 2021 Oct;70(10):2237-2249. doi: 10.2337/db21-0028. Epub 2021 Jul 20. Diabetes. 2021. PMID: 34285117 Free PMC article.
-
Bring Back the Rat!J Gerontol A Biol Sci Med Sci. 2020 Feb 14;75(3):405-415. doi: 10.1093/gerona/glz298. J Gerontol A Biol Sci Med Sci. 2020. PMID: 31894235 Free PMC article. Review.
-
Senescent macrophages in cancer: roles in tumor progression and treatment opportunities.Cancer Biol Med. 2025 May 6;22(5):439-59. doi: 10.20892/j.issn.2095-3941.2024.0589. Cancer Biol Med. 2025. PMID: 40329498 Free PMC article. Review.
-
Aging does not reduce heat shock protein 70 in the absence of chronic insulin resistance.J Gerontol A Biol Sci Med Sci. 2012 Oct;67(10):1014-21. doi: 10.1093/gerona/gls008. Epub 2012 Mar 8. J Gerontol A Biol Sci Med Sci. 2012. PMID: 22403054 Free PMC article.
-
The Role of Cdc42 in the Insulin and Leptin Pathways Contributing to the Development of Age-Related Obesity.Nutrients. 2023 Nov 29;15(23):4964. doi: 10.3390/nu15234964. Nutrients. 2023. PMID: 38068822 Free PMC article. Review.
References
-
- Barzilai N, Rossetti L. Age-related changes in body composition are associated with hepatic insulin resistance in conscious rats. Am J Physiol. 1996;270(6 Pt 1):E930–E936. - PubMed
-
- Koh-Banerjee P, Wang Y, Hu FB, et al. Changes in body weight and body fat distribution as risk factors for clinical diabetes in US men. Am J Epidemiol. 2004;159(12):1150–1159. - PubMed
-
- Bjorntorp P. Abdominal fat distribution and the metabolic syndrome. J Cardiovasc Pharmacol. 1992;20(Suppl 8):S26–S28. - PubMed
-
- Pischon T, Boeing H, Hoffmann K, et al. General and abdominal adiposity and risk of death in Europe. N Engl J Med. 2008;359(20):2105–2120. - PubMed
Publication types
MeSH terms
Substances
Grants and funding
LinkOut - more resources
Full Text Sources
Medical
Miscellaneous
